
Normal Approximation to Binomial Distribution
Loading the math board and drawing, please wait…
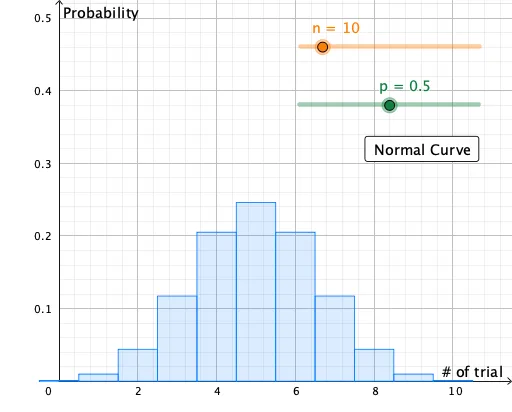
This GeoGebra example dynamically illustrates how the binomial probability histogram approaches the normal distribution curve as the number of trials n increases, demonstrating the central limit theorem in action. Core mathematical concepts include the binomial distribution, normal distribution, probability mass function vs. probability density function, and the approximation rule of thumb (np and n(1-p) both greater than 5). Construction details: the BinomialDist command generates the binomial probability histogram, the Normal command plots the corresponding normal curve with matching mean and standard deviation, sliders n and p adjust parameters, button1 triggers animation or toggles display, and a boolean variable controls the visibility of the normal approximation. Suitable for high school and college statistics courses, this interactive tool helps students grasp the central limit theorem and the conditions for normal approximation, and serves as a classroom demonstration or self-paced exploration resource.
GeoGebra Commands & Parameters
BinomialDist(n, p) → aNormal((n * p), sqrt(((n * p) * (1 - p))), x, false) → f
AI Drawing Prompt Reference
Draw a binomial probability histogram with vertical bars representing the probability mass function for given trial count and success probability. Overlay a smooth normal distribution curve whose mean equals the product of trials and success probability, and whose standard deviation is the square root of that product times the failure probability. Include two sliders to adjust the trial count and success probability, showing how the histogram approaches the normal curve as trials increase, illustrating the central limit theorem.
The prompt above was compiled from the original drawing commands and is for reference only.