
Negative Exponent Model
Loading the math board and drawing, please wait…
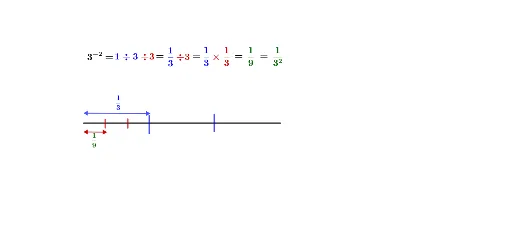
This example demonstrates the graphical characteristics of a negative exponent model. The core mathematical concepts involved are negative exponent functions. Construction highlights include using GeoGebra commands to draw the negative exponent function and constructing a segment through points A and B.
GeoGebra Commands & Parameters
Segment(A, B) → fSegment(C, D) → gSegment(E, F) → hSegment(C, D) → iSegment(E, F) → jSegment(G, H) → kSegment(I, J) → lSegment(M, N) → mSegment(M, N) → nSegment(O, P) → p
AI Drawing Prompt Reference
Draw a negative exponent function graph, including a line segment between point A and point B, a line segment between point C and point D, and another line segment between point E and point F. Then, draw line segments between point G and point H, point I and point J, point M and point N, and point O and point P.
The prompt above was compiled from the original drawing commands and is for reference only.