
Multiplicity Practice
Loading the math board and drawing, please wait…
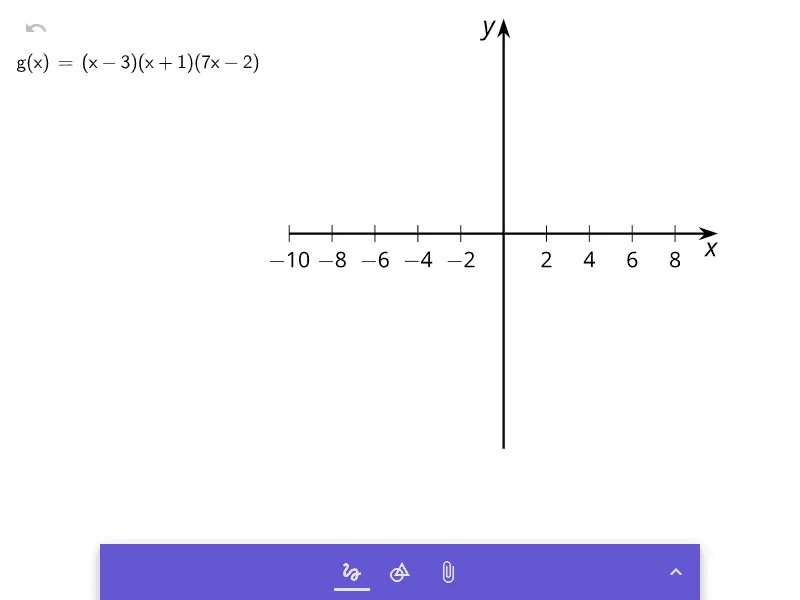
This example demonstrates the relationship between polynomial function graphs and their multiplicities. It involves core math concepts like polynomials, multiplicities, and function graph transformations. Constructed using GeoGebra commands/objects a and pic1, it is suitable for high school mathematics learning to understand how multiplicities affect function graphs.
GeoGebra Commands & Parameters
Formula a
AI Drawing Prompt Reference
Create a graph-based example illustrating the relationship between polynomial function graphs and their multiplicities. Start by defining a polynomial function as the main object and display its formula on the plot. Then focus on how the zeros (the x-values where the polynomial equals zero) reflect multiplicity: make sure the curve’s behavior near each zero matches the idea of different multiplicities, showing the appropriate crossing or tangency at those points. Present the resulting function graph so a student can visually connect multiplicity with the shape of the polynomial curve.
The prompt above was compiled from the original drawing commands and is for reference only.