
Multiple Representations of Linear Equations
Loading the math board and drawing, please wait…
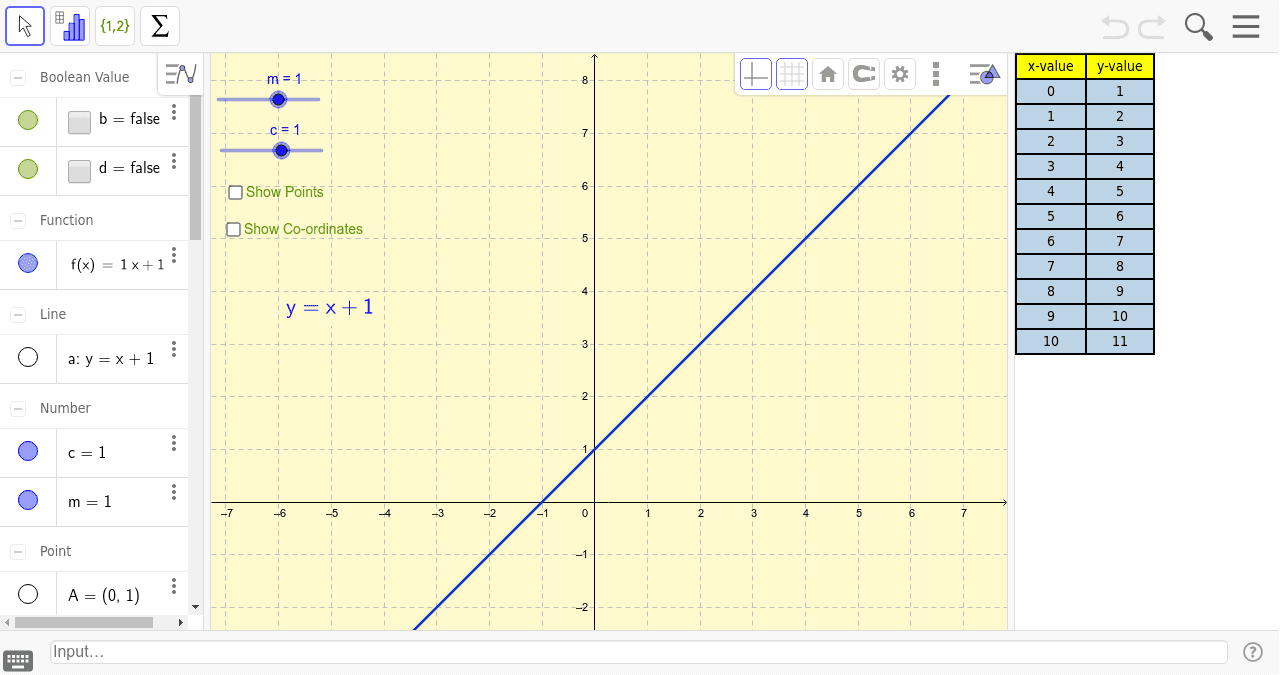
This example demonstrates various forms of linear equations (e.g., slope-intercept, point-slope) and their graphical representations and transformations. Key math concepts include linear equations, slope, y-intercept, function graphs, and analytical geometry. It uses GeoGebra commands like Intersect and LaTeX, along with objects such as m (slope), c (intercept), and f (function). Suitable for high school mathematics education to understand different representations of linear equations and their applications.
GeoGebra Commands & Parameters
Intersect(a, yAxis) → CLaTeX(a) → text1