
Moving Points
Loading the math board and drawing, please wait…
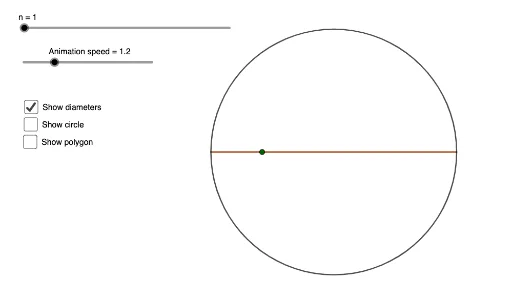
This example demonstrates the dynamic changes of points in geometric figures. It involves real numbers, statistical characteristics, linear regression, and power functions. Using GeoGebra commands such as Circle, Segment, Sequence, Point, and Polygon, complex geometric figures can be constructed. Suitable for high school mathematics education and learning.
GeoGebra Commands & Parameters
Circle(A, 0.5) → eSegment(B, C) → fSequence(Segment[Rotate[B, (((-π)) / n * i), (0, 0)], Rotate[C, (((-π)) / n * i), (0, 0)]], i, 1, n) → L_1Sequence(((0.5 * cos(b)) + (0.5 * cos(((-2 * π / n) * i) - b)), (0.5 * sin(b)) + (0.5 * sin(((-2 * π / n) * i) - b))), i, 1, n) → L_2Point(e) → EPolygon(L_2) → poly1Sequence(Segment[Element[L_2, i], Element[L_2, i + 1]], i, 1, n) → l1Segment(Element[L_2, 1], Element[L_2, n]) → i