
Motion Diagram and Position-Velocity-Time Graphs
Loading the math board and drawing, please wait…
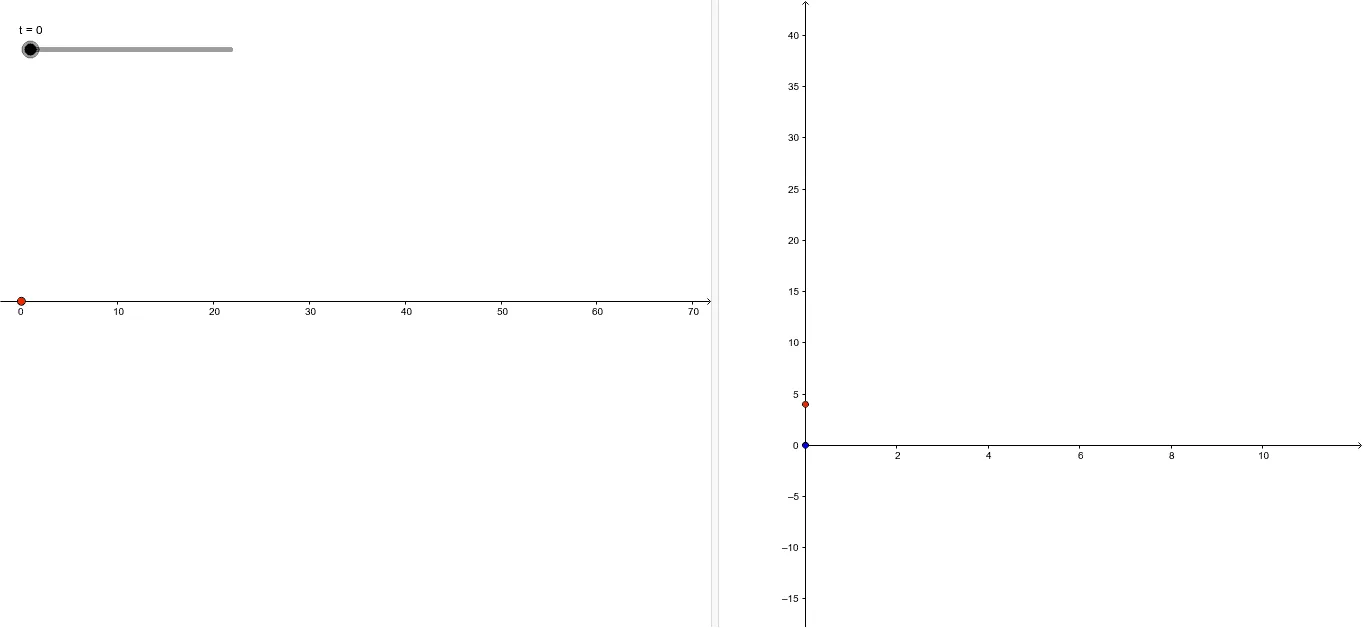
This example illustrates the relationship between motion diagrams and position-velocity-time graphs. Key mathematical concepts include kinematics involving position, velocity, and time. Using GeoGebra commands such as t, x_i, a_x, v_{xi}, x_t, Particle, Position, etc., the motion state of an object is visually demonstrated. Suitable for high school physics and mathematics education.
GeoGebra Commands & Parameters
Numeric t(0.0)Numeric x_i(0.0)Numeric a_x(0.0)Numeric v_{xi}(4.0)x_i + (v_{xi} * t) + ((0.5 * a_x) * t^(2))(x_t, 0)(t, x_t)v_{xi} + (a_x * t)(t, v_{xt})