
Module 13: Grouped Data Histogram
Loading the math board and drawing, please wait…
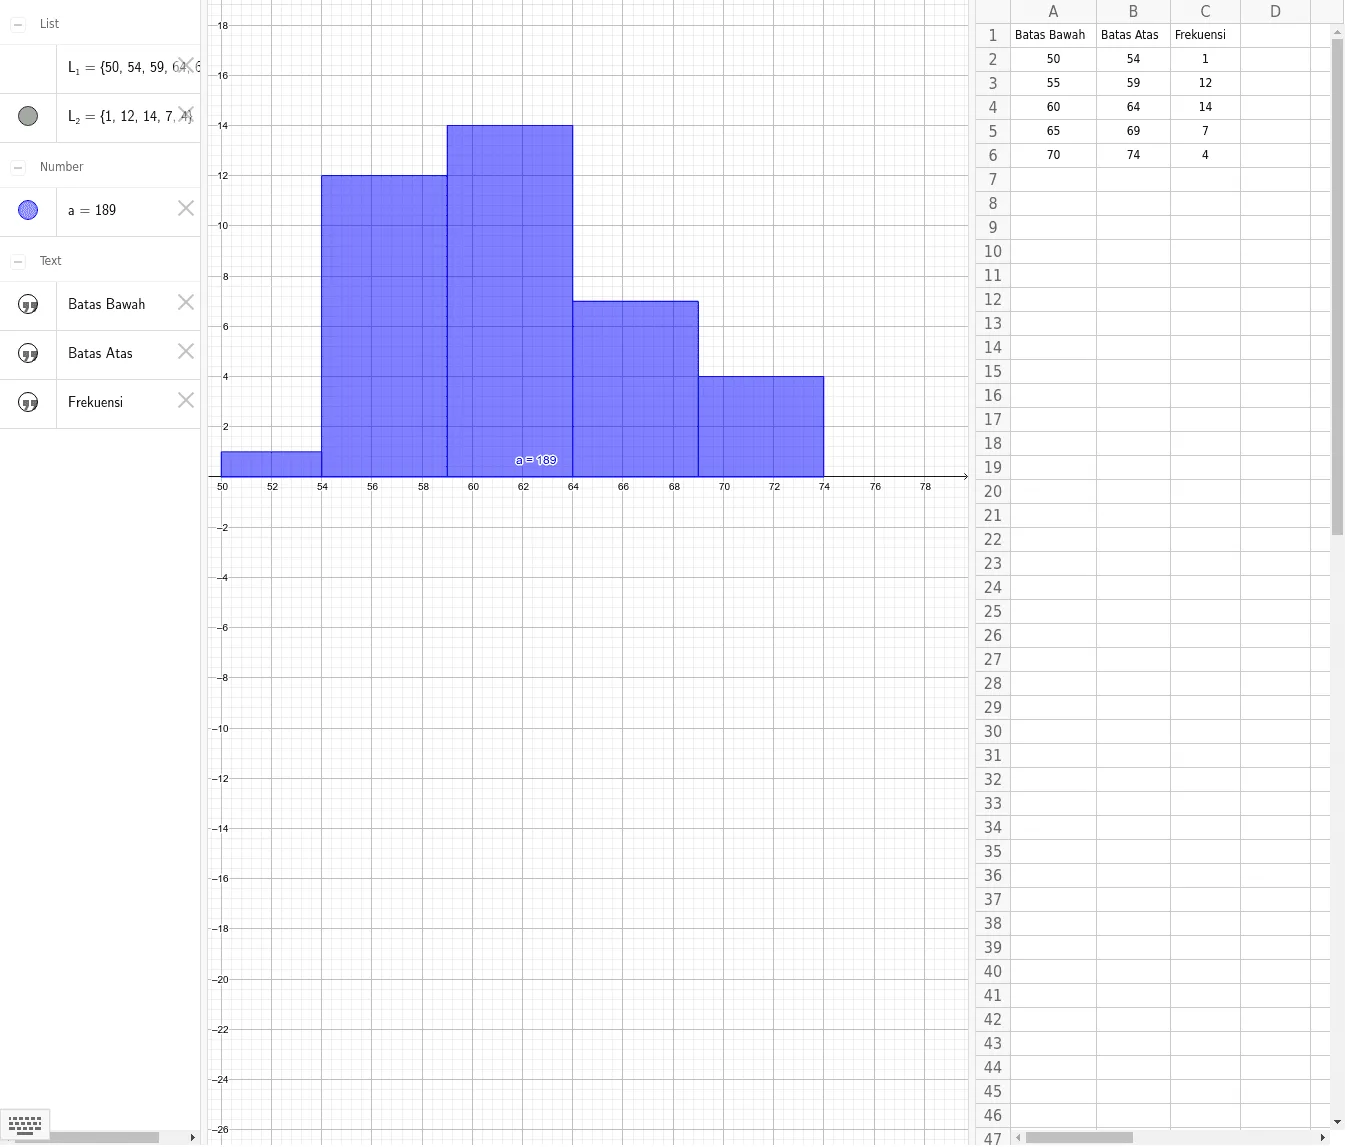
This example demonstrates how to use GeoGebra to create a histogram for grouped data, visually representing data distribution. Core math concepts include data statistics, frequency distribution, and histogram construction methods. Key GeoGebra commands used are Histogram, with objects A1-C6, L1-L3, and a, where slider a adjusts grouping intervals. Suitable for junior high school mathematics teaching, focusing on introductory probability statistics and data analysis skills.
GeoGebra Commands & Parameters
Histogram(L_1, L_2) → a