
Modes of Vibration in a String
Loading the math board and drawing, please wait…
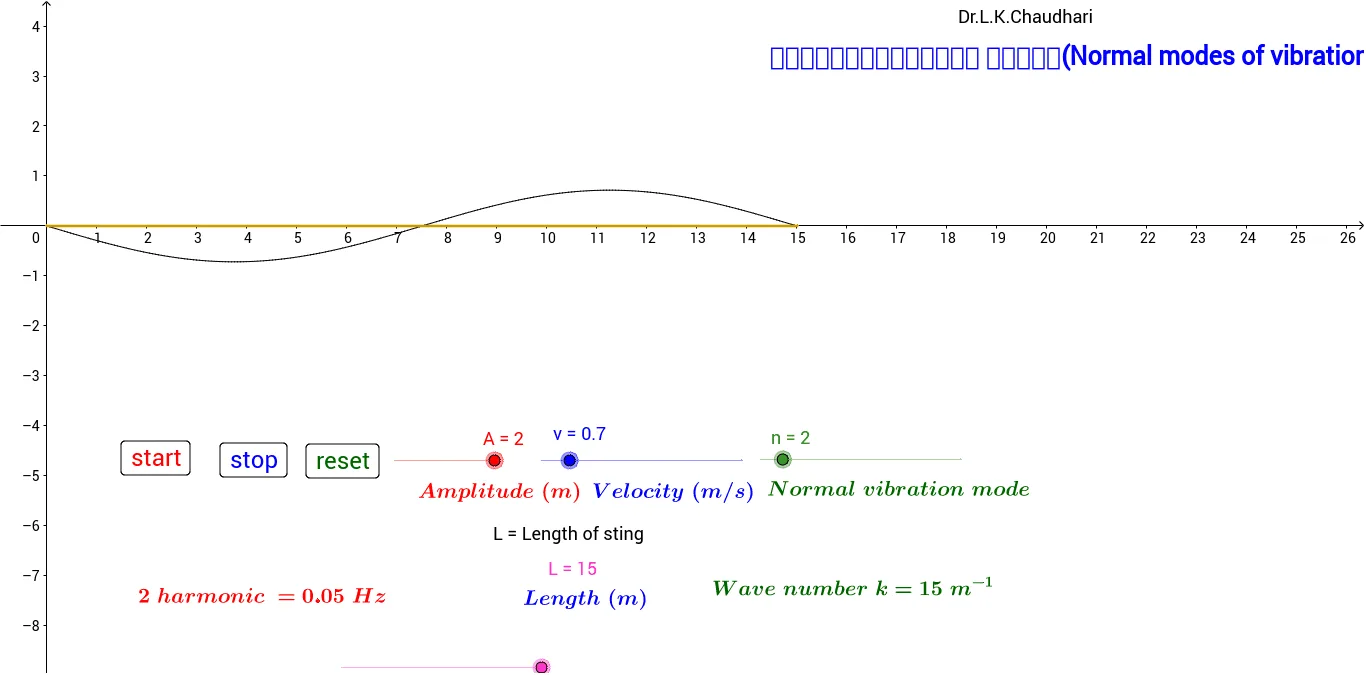
①This GeoGebra example dynamically visualizes standing wave patterns on a string for different vibration modes, showing the displacement of each point over time. ②Core mathematical concepts include standing waves, harmonic modes, wavelength-frequency relationships, and the integer-multiple condition for mode numbers, with an implicit limit concept as mode number grows. ③Construction uses Segment to draw the string boundaries, CurveCartesian to generate the wave curves; sliders n (mode number), t (time), L (length), A (amplitude) control parameters; functions g, f, h define displacement profiles; buttons (pulsante) and text objects (testo) provide interactive controls and labels. ④Suitable for high school or college physics wave units, and for mathematics classes on parametric curves and function graphing, helping students connect physical vibration modes with mathematical expressions.
GeoGebra Commands & Parameters
Segment(B, C) → bCurveCartesian(s, h(s), s, 0, L) → a
AI Drawing Prompt Reference
Visualize the vibration modes of a taut string to show standing wave patterns, with the displacement of each point changing over time. Use line segments to define the string's boundaries and parametric curves to generate the wave shapes. Include sliders for mode number, time, string length, and amplitude to control these parameters, with functions defining the displacement profiles. The visualization should dynamically illustrate how wave patterns change with different mode numbers, highlighting concepts like standing waves, harmonic modes, wavelength-frequency relationships, and the integer multiple condition for mode numbers.
The prompt above was compiled from the original drawing commands and is for reference only.