
Mean & Standard Deviation Using Spreadsheet
Loading the math board and drawing, please wait…
In collections
Math Year 4 Unit Probability & Statistics
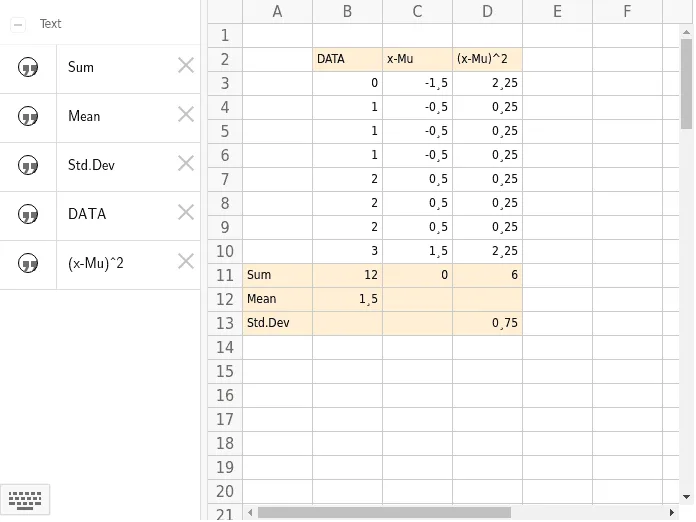
This example demonstrates how to calculate mean and standard deviation using a spreadsheet. Key mathematical concepts include mean and standard deviation. By examining the commands used, such as Sum, one can understand how to process data in GeoGebra. Suitable for high school math education or students learning probability and statistics.
GeoGebra Commands & Parameters
Sum(B3:B10) → B11Sum(C3:C10) → C11Sum(D3:D10) → D11
AI Drawing Prompt Reference
Create a statistical chart with three sets of data, each containing 8 data points, connected sequentially by colored line segments. For each set, draw a horizontal line segment above to represent the sum of the data points. Finally, label the mean and standard deviation for each set at the bottom of the chart to illustrate the statistical characteristics of the data.
The prompt above was compiled from the original drawing commands and is for reference only.