
Mean, Mode, Median, Range Data Set Generator
Loading the math board and drawing, please wait…
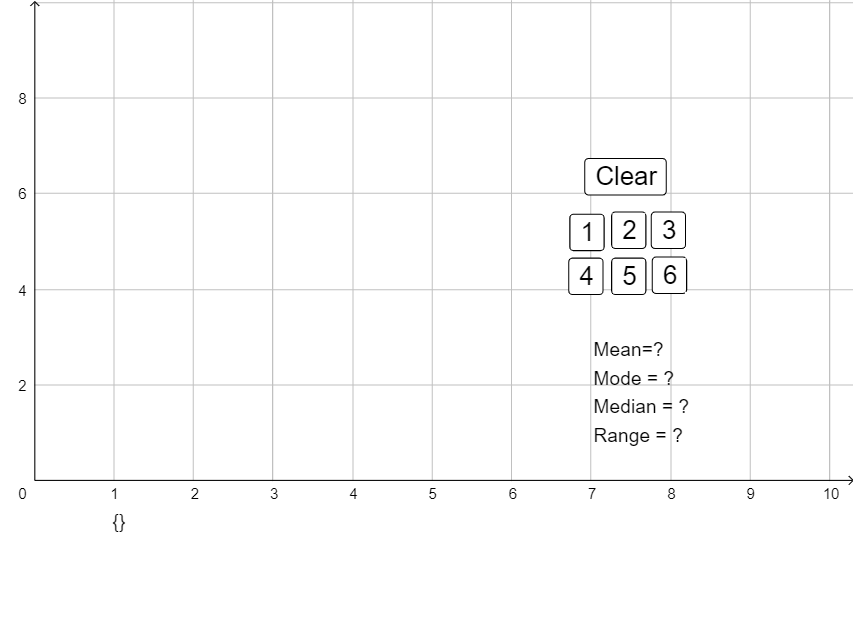
This example demonstrates how to use GeoGebra to generate a data set and calculate its mean, median, mode, and range. The core math concepts involved include mean, median, mode, range, statistical data analysis. Key GeoGebra commands/objects used in the construction include BarChart (bar chart), mean (average), Mode (mode), Median (median), and Sum (sum). It is suitable for high school mathematics courses on statistics and probability, providing an intuitive display of data distribution characteristics and the calculation of statistical measures.
GeoGebra Commands & Parameters
BarChart(L, 1, 1) → bmean(L) → meanMode(L) → modeMedian(L) → medianSum(L) → c