
Mean, Median, Mode: Tabulated Data with Unknown Frequency
Loading the math board and drawing, please wait…
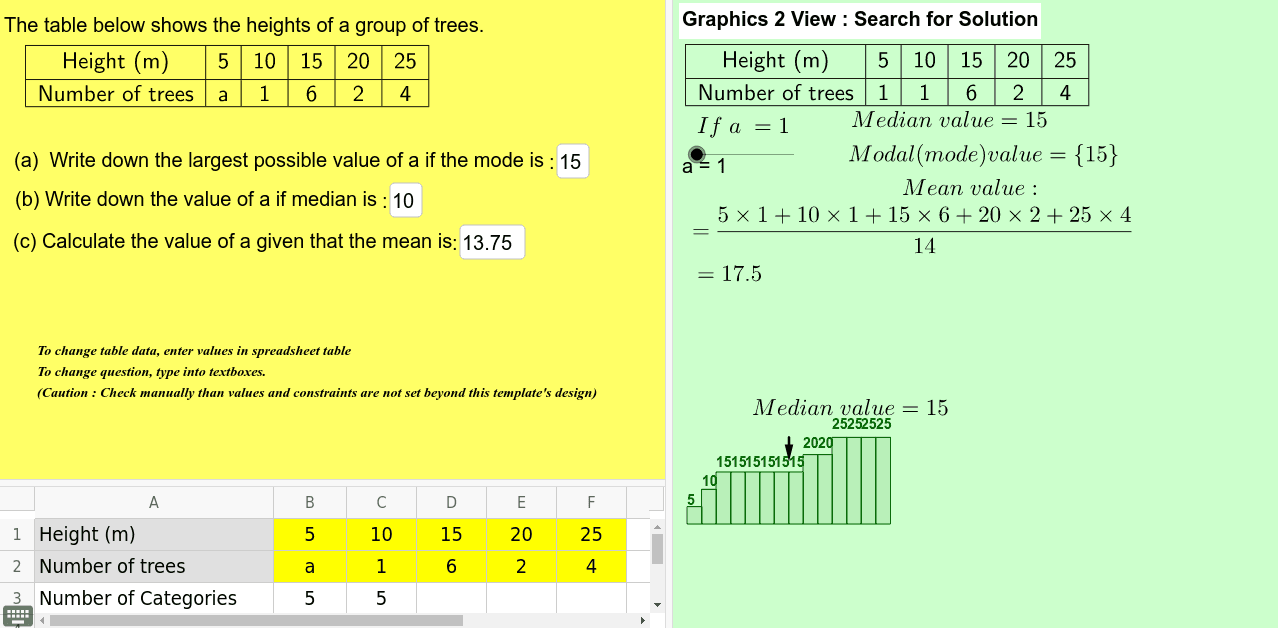
This GeoGebra example demonstrates a five-category frequency table in which one frequency is unknown, allowing users to adjust category values and frequencies and observe how mean, median, and mode change. It covers tabulated data, frequency, central tendency, weighted data, sorting, and statistical measures. The construction uses Sequence, RemoveUndefined, Insert, and Join to build category and frequency lists, TableText and Textfield/inputBox objects to display the table and inputs, and Mean, Median, Mode, Sum, and Vector commands to compute target statistics. Suitable for middle-school or high-school statistics lessons on data organization and measures of center.
GeoGebra Commands & Parameters
Sequence(Cell[i + 1, 1], i, 1, B3) → ListCategoryValuesSequence(Cell[i + 1, 2], i, 1, B3) → ListFrequencyValuesFromCellsRemoveUndefined(ListFrequencyValuesFromCells) → ListFrequencyValuesRemovedUndefinedInsert(a, ListFrequencyValuesRemovedUndefined, B4) → ListFrequencyValueswithVariableInsert("a", ListFrequencyValuesRemovedUndefined, B4) → ListFrequencyValueswithTextJoin({ListCategoryTitle, ListCategoryValues}) → ListCategoryTextfield(targetmode) → inputBox1Textfield(targetmedian) → inputBox2Textfield(targetmean) → inputBox3Median(Take[ListCategory, 2, 5], Take[ListFrequencyNum, 2, 5]) → medianvalue1Join({ListFrequencyTitle, ListFrequencyValueswithText}) → ListFrequencyVariableTextTableText({ListCategory, ListFrequencyNum}, "c|_") → Table2SolutionTableText({ListCategory, ListFrequencyVariableText}, "c|_") → Table1ProblemJoin({ListFrequencyTitle, ListFrequencyValueswithVariable}) → ListFrequencyVariableSearchTableText({ListCategory, ListFrequencyVariableSearch}, "c|_") → Table3HiddenSearchSum(Take[ListFrequencyVariableSearch, 2]) → totalfrequencyMedian(Take[ListCategory, 2, numberofcategories + 1], Take[ListFrequencyVariableSearch, 2, numberofcategories + 1]) → medianvaluesearchSequence(If[i < numberofcategories, "+", ""], i, 1, numberofcategories) → ListAddSignSequence(Element[ListCategoryValues, i] + "×" + (Element[ListFrequencyValueswithVariable, i] + Element[ListAddSign, i]), i, 1, numberofcategories) → CategoryFrequencyProductListSequence(Element[MatrixAllSortedSearch, 1, i], i, 1, totalfrequency) → ListAllSortedSearchSequence(Polygon[(i - 1, 0), (i, 0), (i, Element[ListAllSortedSearch, i]), (i - 1, Element[ListAllSortedSearch, i])], i, 1, totalfrequency) → DataVisualBarSequence(Text[Element[ListAllSortedSearch, i], (i - 1, Element[ListAllSortedSearch * 1.1, i])], i, 1, totalfrequency) → DataVisualTextMean(Take[ListCategory, 2, numberofcategories + 1], Take[ListFrequencyVariableSearch, 2, numberofcategories + 1]) → meanvaluesearchMode(ListAllSortedSearch) → modesearchVector(((2 * medianposition - 1) / 2, Element[ListAllSortedSearch, totalfrequency]), ((2 * medianposition - 1) / 2, Max[Element[ListAllSortedSearch, totalfrequency] * 0.5, Element[ListAllSortedSearch, medianposition] * 1.2])) → medianpositionpointerSum(CategoryFrequencyProductList) → TextSumCategoryFrequency
AI Drawing Prompt Reference
Create a frequency table with five categories, one of which has an unknown frequency. Users can adjust the category values and frequencies to observe changes in mean, median, and mode. Draw a bar chart to represent the frequency data and indicate the median position on the chart. Finally, calculate and display the mean, median, and mode.
The prompt above was compiled from the original drawing commands and is for reference only.