
Mean, Median, Mode and Quartiles: Interactive Statistics Practice
Loading the math board and drawing, please wait…
In collections
Statistics and Probability with Mr Downes
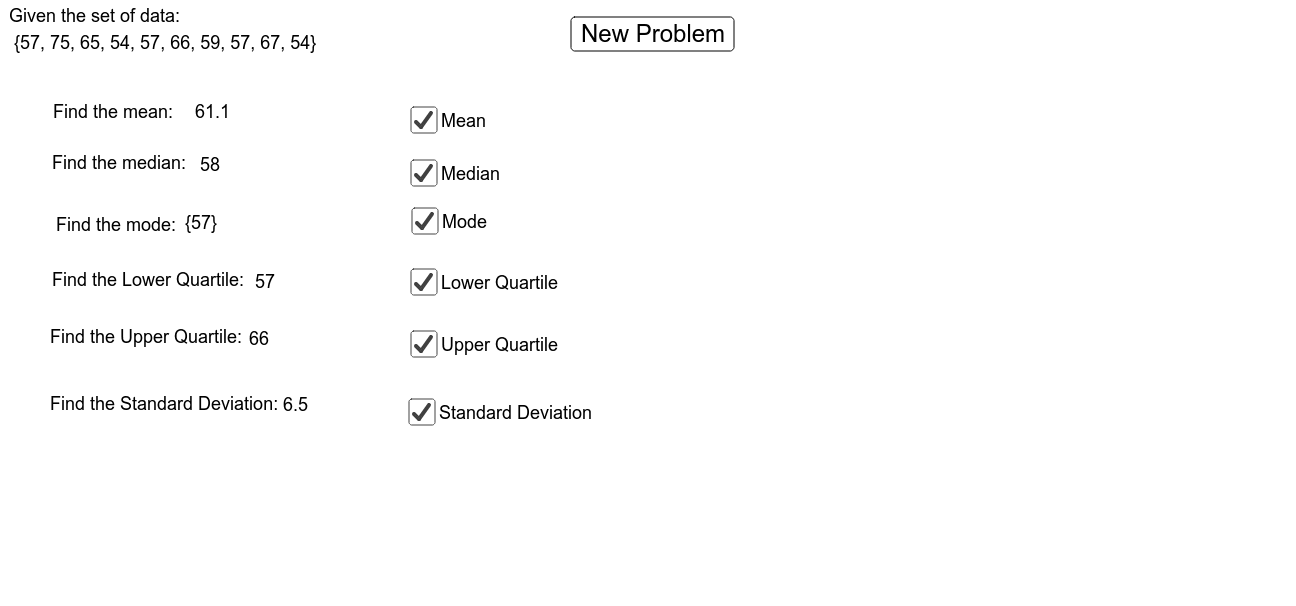
This GeoGebra example demonstrates how to compute descriptive statistics for a given data set, including the mean, median, mode, lower quartile, upper quartile, and standard deviation, with an interactive button to check answers. The core mathematical concepts are measures of central tendency and dispersion, as well as the five-number summary represented by a boxplot. Construction highlights: the Sequence command generates the data list list1, then statistical functions such as Median, Mode, Mean, SD, LowerQuartile, and UpperQuartile are applied to compute each statistic, with text objects text2 through text13 displaying the results and a button (button1) triggering answer verification. Suitable for middle or high school statistics lessons, this resource helps students intuitively grasp the meaning and calculation of each statistical measure.
GeoGebra Commands & Parameters
Sequence(Random[50, 75] + a - a, a, 1, 10) → list1Median(list1) → MedianMode(list1) → ModeMean(list1) → MeanSD(list1) → StandardDeviationQ1(list1) → LowerQuartileQ3(list1) → UpperQuartile
AI Drawing Prompt Reference
Create a data visualization chart showing a set of randomly generated data and its statistical description. First, generate 10 random numbers between 50 and 75, then calculate and display the mean, median, mode, standard deviation, lower quartile, and upper quartile of this dataset. Use text labels to clearly indicate each statistic, and add an interactive button to verify the calculations. The chart should include the data list, statistical text labels, and a verification button to intuitively show the data distribution and statistical properties.
The prompt above was compiled from the original drawing commands and is for reference only.