
Mean Confidence Intervals
Loading the math board and drawing, please wait…
In collections
Statistics Demonstrations
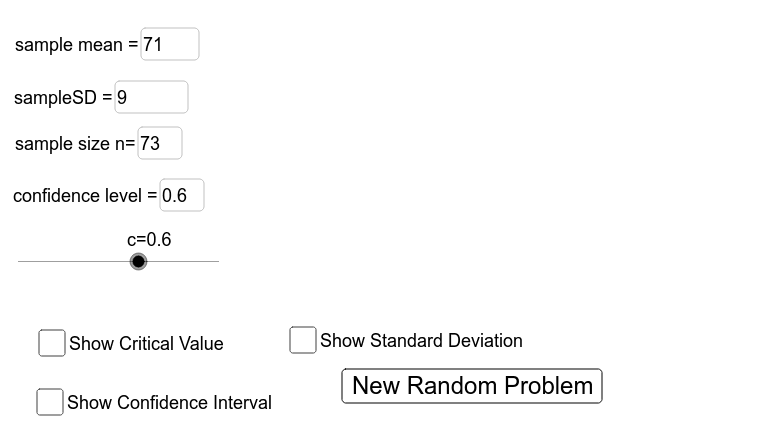
This example demonstrates how to compute a confidence interval for a population mean based on a sample. Key mathematical concepts include confidence intervals, sample standard deviation, sample mean, and confidence level. Using GeoGebra commands such as Textfield, SampleStDev, and ShowConfidenceInterval, users can dynamically adjust sample data and observe changes in the confidence interval. Suitable for high school mathematics education and learning.
GeoGebra Commands & Parameters
Textfield(confidence) → inputConfidenceLevelTextfield(n) → inputSampleSizeTextfield(sampleMean) → inputSampleMeanTextfield(SampleStDev) → inputSampleSD
AI Drawing Prompt Reference
Create a graph showing confidence intervals, including the input confidence level, sample size, sample mean, and sample standard deviation. First, enter the confidence level, then the sample size, followed by the sample mean and standard deviation, and finally, dynamically display the confidence interval based on these inputs.
The prompt above was compiled from the original drawing commands and is for reference only.