
Mean and Median of a Curve
Loading the math board and drawing, please wait…
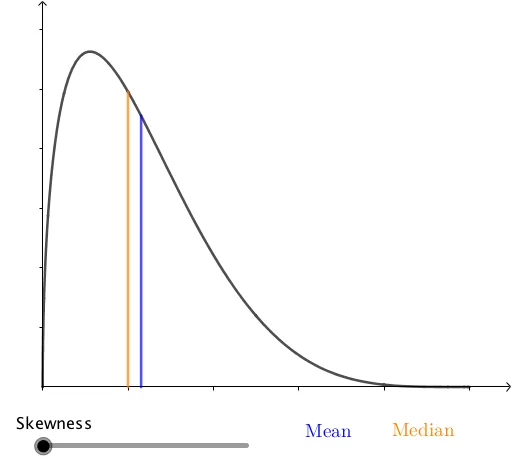
This example demonstrates how to visualize and analyze the mean and median of an arbitrary curve using GeoGebra. Key math concepts include probability & statistics, integral calculus, function graphing, and linear functions. GeoGebra commands like If, Integral, and Segment are used, along with objects such as a, n, f, mean, and median. Suitable for high school and above, helping learners understand distribution characteristics and the geometric meaning of statistical measures.
GeoGebra Commands & Parameters
If(a ≤ 5, a, 5) → a_1If(a ≥ 5, 10 - a, 5) → b_1Integral(f, 0, 1) → bIntegral((x^(a_1 + b_1 - 1) * ℯ^((-x))), 0, Infinity) → cIntegral((x^(a_1 - 1) * ℯ^((-x))), 0, Infinity) → dIntegral((x^(b_1 - 1) * ℯ^((-x))), 0, Infinity) → eIntegral(g, 0, 1) → hSegment((mean, 0), (mean, g(mean))) → iSegment((median, 0), (median, g(median))) → j
AI Drawing Prompt Reference
Draw a graph showing the mean and median of a curve. First, create a function f(x), then compute its integral to get a value. Next, define two points representing the mean and median. Draw vertical line segments from these points to show their relationship with the curve. Finally, add annotations to explain the statistical concepts in the graph.
The prompt above was compiled from the original drawing commands and is for reference only.