
Maximal Directional Derivative Visualization
Loading the math board and drawing, please wait…
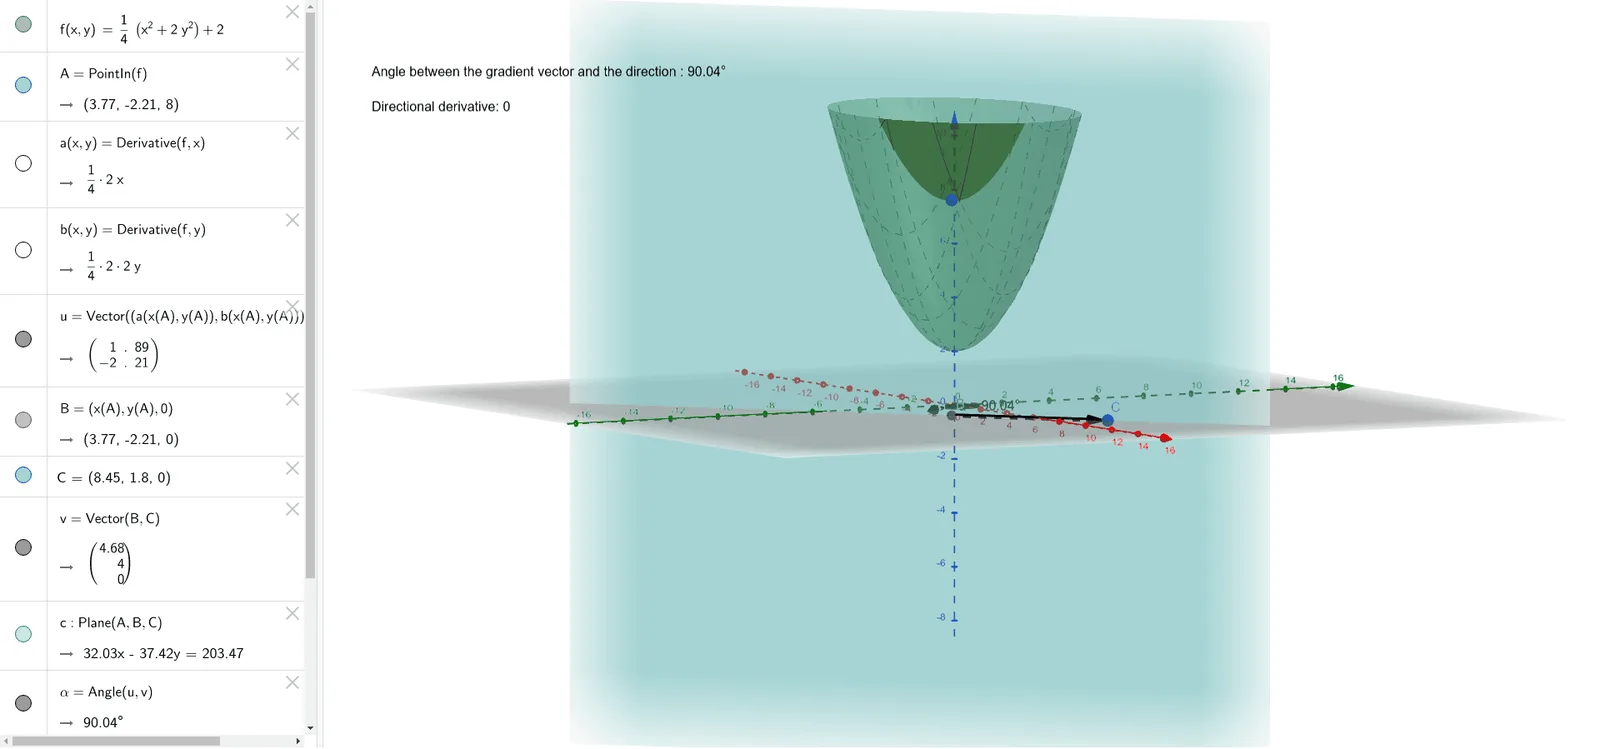
This GeoGebra example demonstrates the concept of directional derivative on a surface in 3D space, highlighting the direction in which the rate of change is maximal. It visually connects the gradient vector to the steepest ascent direction on a surface. Core mathematical concepts include directional derivatives, gradient, maximum rate of change, and the geometric relationship between vectors and tangent planes. The construction uses commands such as PointIn to place a point on the surface, Derivative to compute derivatives, Vector and Plane to define direction vectors and tangent planes, and Angle to measure angles. Dynamic text objects display numerical values. This resource is suitable for university-level calculus or multivariable function courses, as well as advanced high school mathematics, to illustrate the geometric meaning of gradient and directional derivatives.
GeoGebra Commands & Parameters
PointIn(f) → ADerivative(f, x) → aDerivative(f, y) → bVector((a(x(A), y(A)), b(x(A), y(A)))) → uVector(B, C) → vPlane(A, B, C) → cAngle(u, v) → α
AI Drawing Prompt Reference
Draw a 3D surface and highlight its gradient vector and tangent plane. Show the geometric relationship between the gradient vector and the tangent plane, and how they indicate the direction of maximum change. Use arrows and angle measurements to visualize these concepts, making the graph intuitively present the relationship between the gradient and directional derivatives.
The prompt above was compiled from the original drawing commands and is for reference only.