
Mathematical Demonstration of Mean, Equations, Standard Deviation, Logarithm, an
Loading the math board and drawing, please wait…
In collections
Symmetry, Transformation and Tessellation
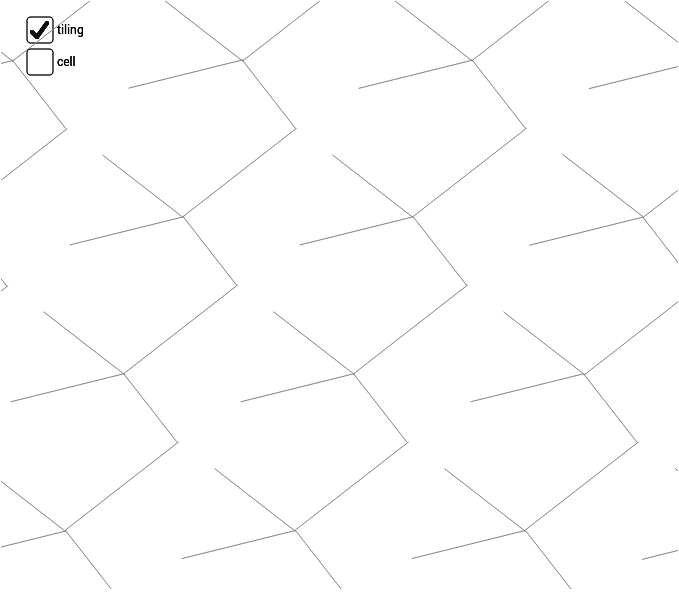
This example demonstrates key mathematical concepts such as arithmetic mean, equation solving, standard deviation calculation, logarithmic operations, and probability tree diagram construction through interactive graphics. Core concepts include mean, equations, standard deviation, logarithms, and tree diagrams. It is constructed using GeoGebra commands like Point, Midpoint, Vector, Segment, and Sequence. Suitable for high school and above, focusing on probability statistics and analytical geometry.
GeoGebra Commands & Parameters
Point(xAxis) → BMidpoint(A, B) → EMidpoint(B, D) → FMidpoint(D, C) → GMidpoint(C, A) → HMidpoint(C, B) → IVector(A, B) → uVector(A, C) → vVector(C, D) → wVector(B, D) → aSegment(H, F) → bSegment(E, G) → cSegment(J, K) → eSegment(K, L) → fSegment(K, M) → gSegment(K, N) → hSequence(Translate[Sequence[Translate[cell1, Vector[(n * u)]], n, -3, 3], Vector[(m * v)]], m, -3, 3) → tiling
AI Drawing Prompt Reference
Draw a graphic demonstrating mathematical concepts, including points on a coordinate axis and midpoints connecting these points to form vectors, using these vectors to construct multiple parallelograms and triangles, showing mean, standard deviation, and probability tree diagrams, with vectors having parallel and perpendicular relationships, presenting a geometric construction aesthetic.
The prompt above was compiled from the original drawing commands and is for reference only.