
Marble Probability Plot
Loading the math board and drawing, please wait…
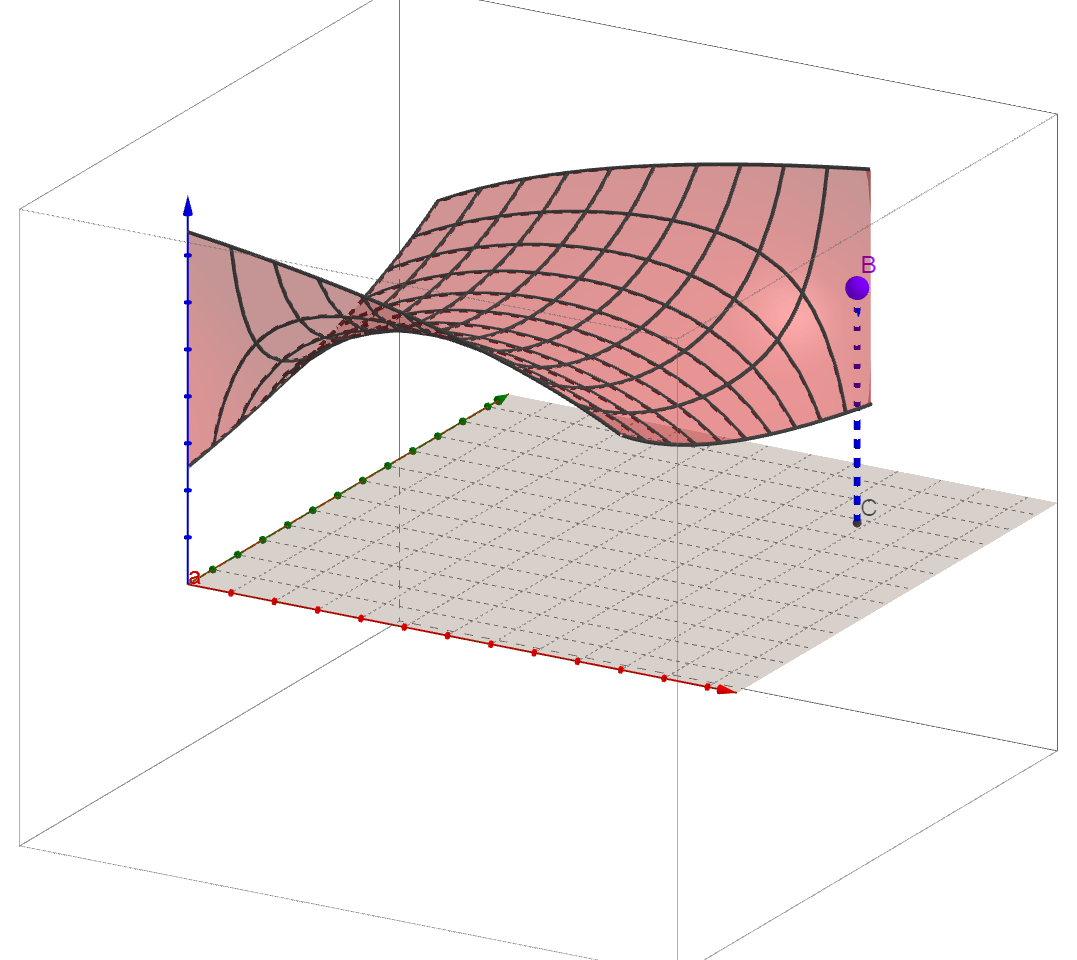
This example demonstrates probability calculations and visualization for marbles distributed across different regions. It involves core math concepts like Probability & Statistics, area calculations of geometric shapes, and percentage/fraction representation. Construction highlights include using GeoGebra commands such as Function, Polygon, PointIn, and Segment to model marble投放 and calculate probabilities. Suitable for high school mathematics teaching to understand the application of probability combined with geometry.
GeoGebra Commands & Parameters
Function((5 * (x / (x + y) + (10 - x) / (20 - x - y))), 0, 10, 0, 10) → aPolygon((0, 0), (50, 0), (50, 50), (0, 50), (0, 0)) → poly1, g, h, i, j, kPointIn(poly1) → ASegment(B, C) → fPolygon((0, 0), (50, 0), (50, 50), (0, 50), (0, 0)) → poly1_1, g_1, h_1, i_1, j_1, k_1Polygon((0, 0), (50, 0), (50, 50), (0, 50), (0, 0)) → poly1_2, g_2, h_2, i_2, j_2, k_2
AI Drawing Prompt Reference
Draw a square region with side length 50, divided into two parts by a line segment. Place a random point inside the square to represent a marble's position. Above or beside the square, plot a smooth curve representing a probability function for the marble landing in different areas, with both axes ranging from 0 to 10. The curve should relate to the square's geometry, showing how probability varies with position. The overall figure illustrates the combination of geometric regions and probability calculations.
The prompt above was compiled from the original drawing commands and is for reference only.