
Marble Bag Simulation
Loading the math board and drawing, please wait…
In collections
Statistics Demonstrations
Statistics Demonstrations
Statistics Demonstrations
Statistics Demonstrations
Statistics Demonstrations
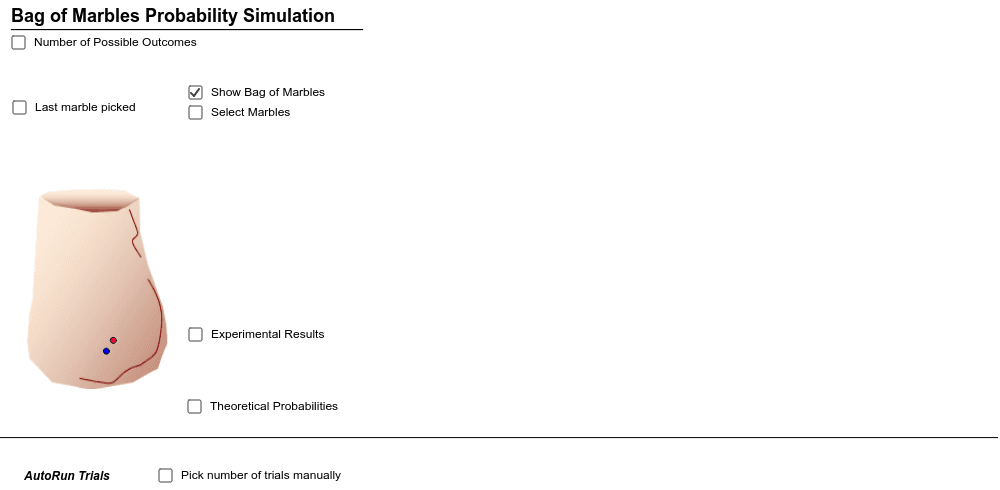
This example demonstrates the process of randomly selecting marbles (with replacement) from a bag containing different colored marbles, and displays the probability distribution of the selection results through bar charts. Key math concepts include probability & statistics, percentages, ratios, and function graphs. It utilizes GeoGebra commands/objects like If, Circle, Sequence, CountIf, Vector, Element, Polygon, Midpoint, Line. Suitable for high school students learning probability statistics and data analysis.
GeoGebra Commands & Parameters
If(N_{colors} < -1, R, 0) → R2If(N_{colors} < -1 * 2, G, 0) → G2If(N_{colors} < -1 * 3, P, 0) → P2If(N_{colors} < 0, B, 0) → B2If(rand_{bag-blue} > 0.5, -1, 1) → posneg_{blue}If(rand_{bag-red} > 0.5, 1, -1) → posneg_{red}Circle(Drawn_{marble-center}, 0.3) → MarbleDrawnCircleRedCircle(Drawn_{marble-center}, 0.3) → MarbleDrawnCircleGreenCircle(Drawn_{marble-center}, 0.3) → MarbleDrawnCircleBlueCircle(Drawn_{marble-center}, 0.3) → fSequence((x(Marble_{bag-center}) + i * posneg_{red} * 0.05 * random(), y(Marble_{bag-center}) + 0.15 + 0.4 * random()), i, -8, R2 - 9) → Add_{marbles-to-bag-red}If(rand_{bag-green} > 0.5, -1, 1) → posneg_{green}Sequence((x(Marble_{bag-center}) + i * posneg_{green} * 0.05 * random(), y(Marble_{bag-center}) + 0.2 + 0.4 * random()), i, -8, G2 - 9) → Add_{marbles-to-bag-green}If(rand_{bag-purple} < 0.5, 1, -1) → posneg_{purple}Sequence((x(Marble_{bag-center}) + i * posneg_{purple} * 0.05 * random(), y(Marble_{bag-center}) + 0.25 + 0.5 * random()), i, -8, P2 - 9) → Add_{marbles-bag-purple}Sequence(ceil((random() + a - a) * (B + R2 + G2 + P2)) + i - i, i, 1, a) → List_{colors}CountIf(x ≤ B, List_{colors}) → Count_{blue}CountIf(B < x ≤ B + R2, List_{colors}) → Count_{red}CountIf(B + R2 < x ≤ B + R2 + G2, List_{colors}) → Count_{green}CountIf(B + R2 + G2 < x ≤ B + R2 + G2 + P2, List_{colors}) → Count_{purple}Circle((x(Marble_{bag-center}), y(Marble_{bag-center})), 0.03) → Marble_{blue}Vector(Marble_{bag-center}, D) → vElement(List_{colors}, a) → MarbleDrawnValueSequence((x(Marble_{bag-center}) + i * posneg_{blue} * 0.05 * random(), y(Marble_{bag-center}) + 0.1 + 0.4 * random()), i, -8, B2 - 9) → Add_{marbles-to-bag-blue}Polygon(BlueBarBottomLeft, BlueBarBottomRt, BlueBarTopRt, BlueBarTopLeft) → BlueBar, a_1, c_1, e_1, f_1Polygon(RedBarBottomLeft, RedBarBottomRt, RedBarTopRt, RedBarTopLeft) → RedBar, a_2, c_2, e_2, f_2Midpoint(BlueBarTopLeft, BlueBarTopRt) → BlueBarTopMidpointPolygon(GreenBarBottomLeft, GreenBarBottomRt, GreenBarTopRt, GreenBarTopLeft) → GreenBar, a_3, c, e, f_3Polygon(PurpleBarBottomLeft, PurpleBarBottomRt, PurpleBarTopRt, PurpleBarTopLeft) → PurpleBar, h, i, j, kMidpoint(RedBarTopLeft, RedBarTopRt) → RedBarTopMidptMidpoint(GreenBarTopLeft, GreenBarTopRt) → GreenBarTopMidptMidpoint(PurpleBarTopLeft, PurpleBarTopRt) → PurpleBarTopMidptLine(DividerLeft, DividerRight) → l
AI Drawing Prompt Reference
Simulate randomly drawing marbles of different colors from a bag and display the probability distribution of the results using bar charts. Draw the bag and place randomly generated red, green, and purple marbles inside it. Simulate the drawing process by placing a drawn marble at the center, and use bar charts to show the count distribution of each color.
The prompt above was compiled from the original drawing commands and is for reference only.