
Mapping Diagram for Moebius Function
Loading the math board and drawing, please wait…
In collections
Mapping Diagrams to Visualize Complex Analysis
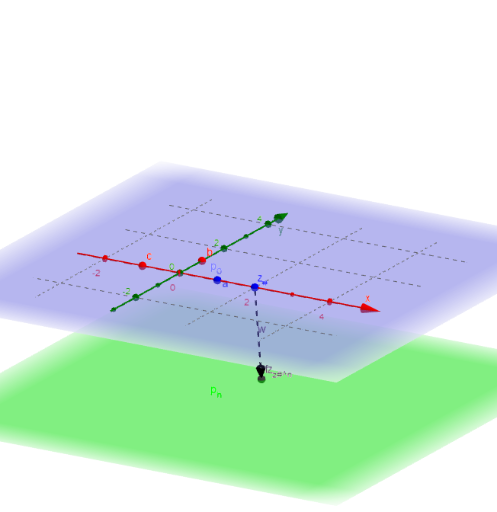
This example visualizes the Moebius function with lines and circles. The Moebius function is a significant function in number theory, used to determine the prime factorization of integers. Using commands like Sequence, PointIn, Vector, Zip, f_mabc, CurveCartesian, Textfield, Line, Point in GeoGebra, the construction demonstrates the mapping of the function. Suitable for high school mathematics education, particularly in coordinate geometry and number theory courses.
GeoGebra Commands & Parameters
Sequence((r * (cos(t) + (sin(t) * ί))), t, 0, 6.28319, 0.5236) → z_*PointIn(p_0) → APointIn(p_h) → BVector(A, B) → uZip(f_mabc[t, a, b, c], t, z_*) → list2f_mabc(z_#, a, b, c) → f_{z#}Vector(a, fz_{z#^n}) → vSequence((x(Element[list2, k]), y(Element[list2, k]), h), k, 1, 12) → list4Sequence(Vector[Element[z_*, j], Element[list4, j]], j, 1, 12) → list5CurveCartesian((m * cos(t)), (m * sin(t)), h, t, 0, 6.283185307179586) → dTextfield(list2) → inputBox1Vector(z_#, fz_{z#^n}) → wLine((0, 0), (1, m)) → fPoint(f) → CVector(C) → z_xToComplex(C) → z_wf_mabc(z_w, a, b, c) → z_LToPoint(z_L) → Z_LLocus(Z_L, C) → gLocus(Z3_L, C) → GSequence(t + ((m * t) * ί), t, -4, 4, 0.5) → LinelistZip(f_mabc[t, a, b, c], t, Linelist) → Linelist2Sequence((x(Element[Linelist2, k]), y(Element[Linelist2, k]), h), k, 1, 12) → Linelist4Sequence(Vector[Element[Linelist, j], Element[Linelist4, j]], j, 1, 12) → Linelist5Circle((0, 0), r) → kVector(C, Z3_L) → jPoint(k) → DToComplex(D) → z_Df_mabc(z_D, a, b, c) → f_{zD}Locus(Z3_D, D) → HVector(D, Z3_D) → l