
Manipulating a, b, and c in Quadratic Functions
Loading the math board and drawing, please wait…
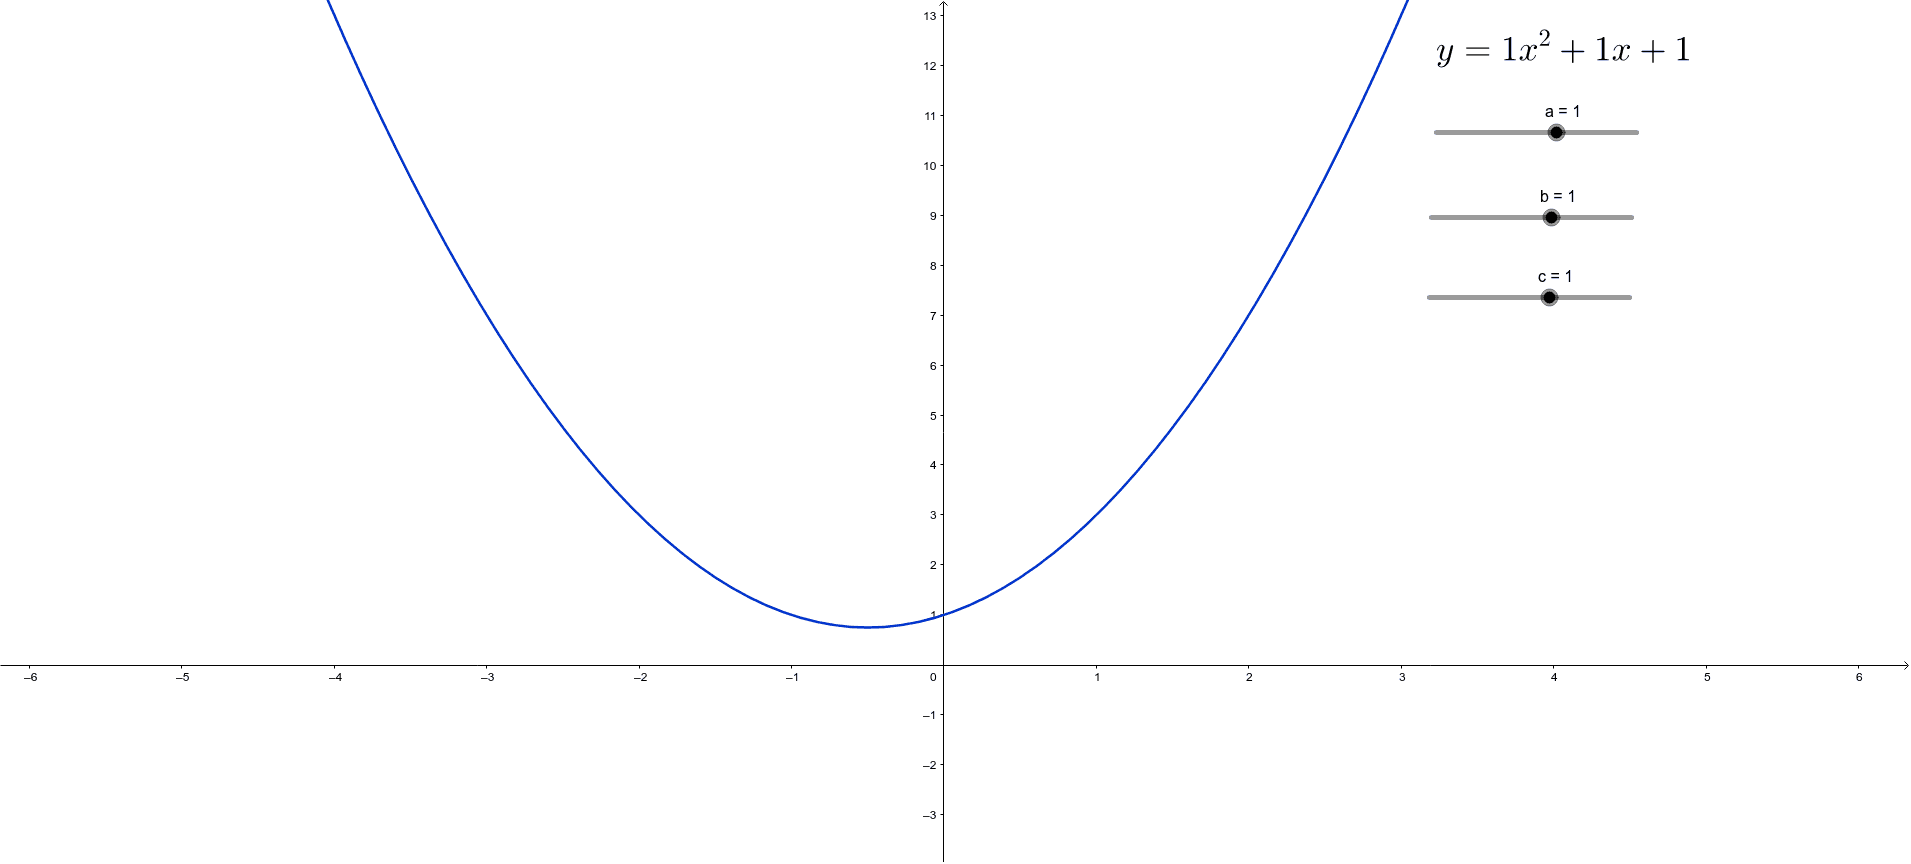
This example demonstrates how adjusting parameters a, b, and c affects the shape and position of a quadratic function's graph. Key math concepts include quadratic functions, graph transformations, vertex, axis of symmetry, and discriminant. GeoGebra commands used are Slider for parameter manipulation, graphing for function visualization, and objects like vertex and axis. Suitable for high school mathematics education to visually understand the properties and impact of parameters on quadratic functions.
GeoGebra Commands & Parameters
Numeric a(1.0)Numeric b(1.0)Numeric c(1.0)y = (a * x^(2)) + (b * x) + c
AI Drawing Prompt Reference
Draw a quadratic function graph where parameters a, b, and c can be adjusted using sliders. Set the initial values of a, b, and c to 1, then plot the function y = ax^2 + bx + c. Change the values of a, b, and c using the sliders to observe how the graph's shape and position change, and understand the properties and impact of these parameters on the quadratic function.
The prompt above was compiled from the original drawing commands and is for reference only.