
Luxembourg Coronavirus Cases in May 2020
Loading the math board and drawing, please wait…
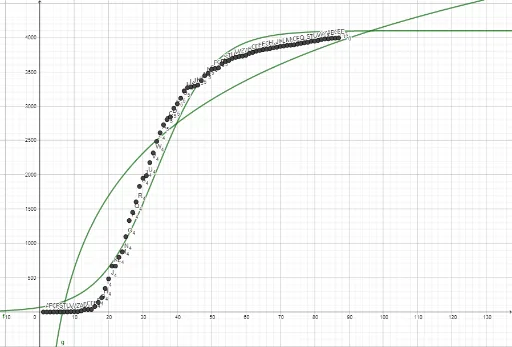
This example visualizes the number of coronavirus cases in Luxembourg in May 2020. It involves data visualization and statistical analysis. Using GeoGebra objects, we can observe the trend of new cases over time. Mainly, points are used to represent daily new cases. Suitable for high school or university statistics and data analysis courses.
GeoGebra Commands & Parameters
2131415162728295105115121713381438153816811714018210193452048421670226702379824875251099261333271453281605291831301950311988