
Lotto Probability
Loading the math board and drawing, please wait…
In collections
ΠΙΘΑΝΟΤΗΤΕΣ
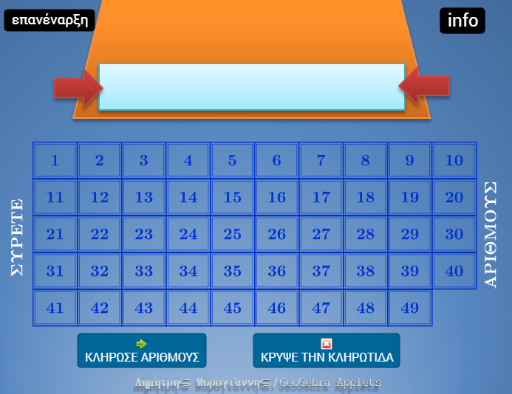
This example demonstrates the difficulty of winning the lottery. It involves the hypergeometric distribution in probability and statistics. Using GeoGebra commands like Sequence and RandomElement, it dynamically simulates the lottery drawing process. Suitable for high school and above students to learn probability and statistics.
GeoGebra Commands & Parameters
Sequence(k, k, 1, 49, 1) → λίστα1RandomElement(λίστα1) → aRandomElement(λίστα1) → bRandomElement(λίστα1) → cRandom(1, 49) → dSequence(Random[1, 49], i, 1, 6, 1) → λίστα2HyperGeometric(49, 6, 6) → fFunction({0.8400000000000009, 4.140000000000002, 4.159999999999999, 4.179999999999999, 4.199999999999999, 4.219999999999999, 4.233333333333332, 4.246666666666665, 4.259999999999999, 4.319999999999999, 4.326666666666665, 4.333333333333332, 4.339999999999999, 4.419999999999999, 4.433333333333333, 4.446666666666665, 4.459999999999999, 4.489999999999998, 4.519999999999999, 4.533333333333332, 4.546666666666666, 4.559999999999999, 4.5666666666666655, 4.573333333333332, 4.579999999999999, 4.586666666666666, 4.593333333333333, 4.599999999999999, 4.604999999999999, 4.609999999999999, 4.614999999999998, 4.619999999999999, 4.624999999999999, 4.629999999999999, 4.634999999999999, 4.639999999999999, 4.64, 4.639999999999999, 4.639999999999999, 4.639999999999999, 4.64, 4.639999999999999, 4.639999999999999, 4.639999999999999, 4.639999999999999, 4.639999999999999, 4.64, 4.639999999999999, 4.639999999999999, 4.639999999999999, 4.64, 4.639999999999999, 4.64, 4.639999999999999, 4.639999999999999, 4.639999999999999, 4.64, 4.639999999999999, 4.639999999999999, 4.639999999999999, 4.639999999999999, 4.639999999999999, 4.639999999999999, 4.639999999999999, 4.639999999999999, 4.64, 4.639999999999999, 4.639999999999999, 4.639999999999999, 4.64, 4.639999999999999, 4.639999999999999, 4.639999999999999, 4.639999999999999, 4.639999999999999, 4.639999999999999, 4.639999999999999, 4.639999999999999, 4.633333333333332, 4.626666666666666, 4.619999999999999, 4.619999999999998, 4.619999999999999, 4.619999999999999, 4.619999999999999, 4.619999999999998, 4.619999999999999, 4.619999999999999, 4.619999999999999, 4.619999999999999, 4.619999999999999, 4.606666666666666, 4.593333333333333, 4.579999999999999, 4.5779999999999985, 4.575999999999999, 4.574, 4.571999999999999, 4.5699999999999985, 4.568, 4.565999999999999, 4.563999999999998, 4.561999999999999, 4.559999999999999, 4.555555555555554, 4.551111111111109, 4.546666666666665, 4.542222222222221, 4.537777777777777, 4.533333333333331, 4.528888888888888, 4.524444444444443, 4.519999999999999, 4.506666666666665, 4.493333333333332, 4.479999999999999, 4.479999999999999, 4.479999999999999, 4.479999999999999, 4.479999999999999, 4.479999999999999, 4.479999999999999, 4.479999999999999, 4.479999999999999, 4.473333333333332, 4.466666666666666, 4.459999999999999, 4.455555555555555, 4.45111111111111, 4.446666666666666, 4.442222222222221, 4.437777777777777, 4.433333333333333, 4.428888888888888, 4.424444444444443, 4.419999999999999, 4.414999999999999, 4.409999999999998, 4.4049999999999985, 4.399999999999999, 4.387999999999999, 4.3759999999999994, 4.363999999999999, 4.3519999999999985, 4.339999999999999, 4.3279999999999985, 4.315999999999999, 4.303999999999999, 4.292, 4.279999999999999, 4.2733333333333325, 4.266666666666666, 4.259999999999999, 4.239999999999999, 4.219999999999999, 4.199999999999999, 4.173333333333333, 4.146666666666666, 4.119999999999999, 4.099999999999999, 4.079999999999999, 4.059999999999999, 4.029999999999999, 3.999999999999999, 3.919999999999999, 3.906666666666666, 3.893333333333332, 3.879999999999999}) → gSequence(Random[1, 49], i, 1, 6, 1) → λίστα3Sample(λίστα1, 6, false) → λίστα4Sort(λίστα4) → λίστα5VerticalText(κείμενο52) → κείμενο53VerticalText(κείμενο54) → κείμενο55
AI Drawing Prompt Reference
Create a lottery probability simulation diagram with 6 randomly generated numbers between 1 and 49, each marked with a different color. Include a histogram showing the probability distribution, with the x-axis representing numbers and the y-axis representing frequency. Below the graph, display the 6 randomly generated numbers and describe the winning probability.
The prompt above was compiled from the original drawing commands and is for reference only.