
Long Run Probability
Loading the math board and drawing, please wait…
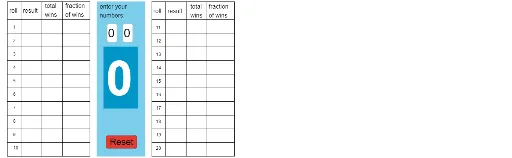
This example demonstrates the concept of long-run probability through geometric and statistical visualization. Key mathematical concepts include median lines in geometry, algebraic subtraction, and binomial distribution. Construction involves GeoGebra commands like Element, If, Length, Intersect, and Sequence to create geometric objects and visualize data. Suitable for high school students or college freshmen to understand the intersection of probability and geometry.
GeoGebra Commands & Parameters
Element(recordk, 1) → u_1If(u_1 ≟ n_1 ∨ u_1 ≟ n_2, 1, 0) → w_1Element(recordk, 2) → u_2If(u_2 ≟ n_1 ∨ u_2 ≟ n_2, 1, 0) → w_2Element(recordk, 20) → u_{20}Element(recordk, 18) → u_{18}Element(recordk, 16) → u_{16}Element(recordk, 14) → u_{14}Element(recordk, 12) → u_{12}Element(recordk, 10) → u_{10}Element(recordk, 8) → u_8Element(recordk, 6) → u_6Element(recordk, 5) → u_5Element(recordk, 4) → u_4Element(recordk, 3) → u_3Element(recordk, 7) → u_7Element(recordk, 9) → u_9Element(recordk, 11) → u_{11}Element(recordk, 13) → u_{13}Element(recordk, 15) → u_{15}Element(recordk, 17) → u_{17}Element(recordk, 19) → u_{19}If(u_{20} ≟ n_1 ∨ u_{20} ≟ n_2, 1, 0) → w_{20}If(u_{18} ≟ n_1 ∨ u_{18} ≟ n_2, 1, 0) → w_{18}If(u_{16} ≟ n_1 ∨ u_{16} ≟ n_2, 1, 0) → w_{16}If(u_{14} ≟ n_1 ∨ u_{14} ≟ n_2, 1, 0) → w_{14}If(u_{12} ≟ n_1 ∨ u_{12} ≟ n_2, 1, 0) → w_{12}If(u_{10} ≟ n_1 ∨ u_{10} ≟ n_2, 1, 0) → w_{10}If(u_8 ≟ n_1 ∨ u_8 ≟ n_2, 1, 0) → w_8If(u_6 ≟ n_1 ∨ u_6 ≟ n_2, 1, 0) → w_6If(u_5 ≟ n_1 ∨ u_5 ≟ n_2, 1, 0) → w_5If(u_4 ≟ n_1 ∨ u_4 ≟ n_2, 1, 0) → w_4If(u_3 ≟ n_1 ∨ u_3 ≟ n_2, 1, 0) → w_3If(u_7 ≟ n_1 ∨ u_7 ≟ n_2, 1, 0) → w_7If(u_9 ≟ n_1 ∨ u_9 ≟ n_2, 1, 0) → w_9If(u_{11} ≟ n_1 ∨ u_{11} ≟ n_2, 1, 0) → w_{11}If(u_{13} ≟ n_1 ∨ u_{13} ≟ n_2, 1, 0) → w_{13}If(u_{15} ≟ n_1 ∨ u_{15} ≟ n_2, 1, 0) → w_{15}If(u_{17} ≟ n_1 ∨ u_{17} ≟ n_2, 1, 0) → w_{17}If(u_{19} ≟ n_1 ∨ u_{19} ≟ n_2, 1, 0) → w_{19}Length(recordk) → sIntersect(xAxis, yAxis) → APoint(xAxis) → BPoint(xAxis) → CPoint(xAxis) → DPoint(xAxis) → EPoint(yAxis) → FSegment(F, A) → fSegment(B, G) → gSegment(H, C) → hSegment(I, D) → iSegment(E, J) → jSegment(A, E) → kSegment(F, J) → lSequence(Segment[A + (0, i), E + (0, i)], i, 0, 10) → list1Sequence(Segment[K + (0, i), O + (0, i)], i, 0, 10) → list2Segment(P, K) → mSegment(L, G_1) → nSegment(M, H_1) → pSegment(I_1, N) → qSegment(O, J_1) → rSegment(J_1, P) → bTextfield(n_1) → InputBox11Textfield(n_2) → InputBox12Polygon(Q_1, Q_2, R, Q) → poly1, q_1, q_2, s_2, q_3Polygon(S, T, U, V) → poly2, s_1, t_1, u, v
AI Drawing Prompt Reference
Draw a coordinate system with x-axis and y-axis. Mark several points on the x-axis and one point on the y-axis. Draw a line segment from the point on the y-axis to the origin. The figure illustrates the relationship between probability and geometry, incorporating concepts like median lines, algebraic subtraction, and binomial distribution.
The prompt above was compiled from the original drawing commands and is for reference only.