
Logistic Map: Iterative Growth and Chaos Visualization
Loading the math board and drawing, please wait…
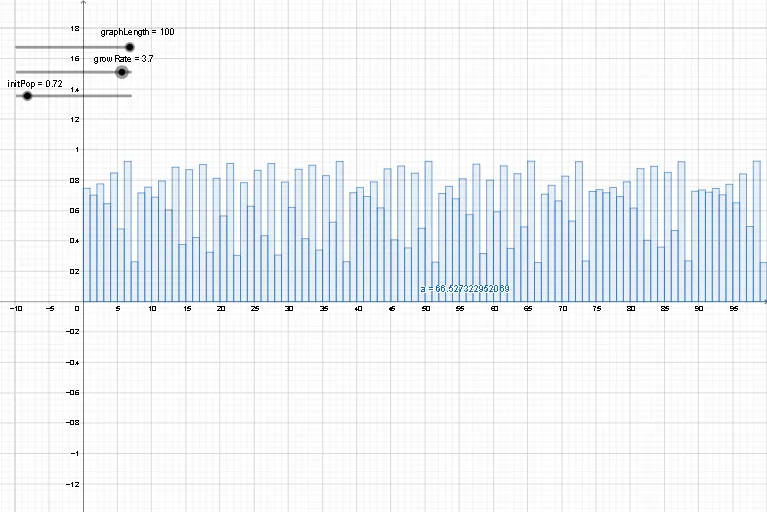
Logistic Map demonstrates iterative growth and chaos through population dynamics. Key mathematical concepts include probability, iterative functions, and dynamic systems. Construction involves using GeoGebra's Sequence and Histogram commands with parameters like w, growRate, f, initPop. Suitable for high school students or college students learning mathematical modeling and dynamic system analysis.
GeoGebra Commands & Parameters
Sequence(k, k, 0, graphLength) → wSequence(Iteration[f(x), initPop, k], k, 1, graphLength) → hHistogram(w, h) → a
AI Drawing Prompt Reference
Create a visualization of the Logistic map's iterative growth and chaos. First, generate a sequence w from 0 to graphLength. Then, use the iterative function f(x) starting from the initial population initPop to create sequence h. Finally, plot a histogram a based on w and h to show population dynamics and chaos.
The prompt above was compiled from the original drawing commands and is for reference only.