
Logarithmic Graph with Geometric Construction
Loading the math board and drawing, please wait…
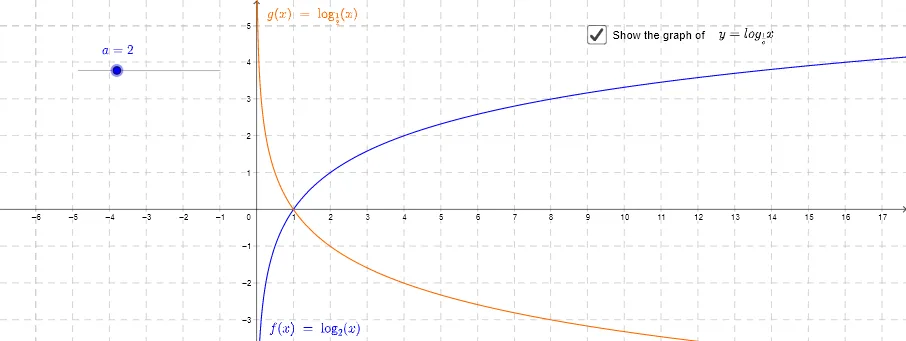
①This example demonstrates the construction of a logarithmic function graph along with associated geometric elements, using points, text labels, and function objects to illustrate connections between the log curve, perimeter, and centroid. ②Core mathematical concepts include logarithmic functions, curve sketching, subtraction, centroid (barycenter), and the interplay between algebra and geometry. ③Construction highlights: Based on the summary, the GeoGebra commands involve the Point command to create points, and objects such as functions a, f, g, text labels text1 through text4, and points A, B, C, D, M, which are used to annotate key positions on the log curve and display computed values, possibly for demonstrating transformations like shifts or scaling, or intersections with axes. ④This is suitable for high school or early college students learning properties of logarithmic functions, function graph transformations, and geometric-algebraic integration, and for teachers creating interactive materials to visualize monotonicity, asymptotes, and geometric features like centroids.
GeoGebra Commands & Parameters
Point(f) → APoint(g) → BPoint(f) → M
AI Drawing Prompt Reference
Draw a logarithmic function graph with key points A, B, and M. Point A is on function f, point B is on function g, and point M is also on function f. Use these points to illustrate the relationship between the log curve, geometric elements, and the centroid, including the properties of the logarithmic function, curve transformations, and the integration of geometry and algebra.
The prompt above was compiled from the original drawing commands and is for reference only.