
Interactive Study of Hyperbola: Foci, Asymptotes, and Geometric Properties
Loading the math board and drawing, please wait…
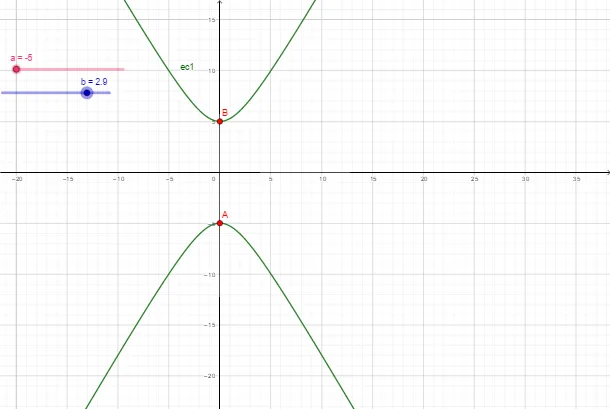
This GeoGebra example provides an interactive study of the hyperbola, demonstrating its standard geometric form and key components such as foci, vertices, and asymptotes. The core mathematical concepts include the definition of a hyperbola as the locus of points where the absolute difference of distances to two fixed foci is constant, the standard equation, transverse and conjugate axes, eccentricity, and the equations of asymptotes. The construction uses objects a, A, B, b, and ec1, where a and b denote the semi-transverse and semi-conjugate axes, A and B are likely foci or vertices, and ec1 may represent eccentricity or an auxiliary circle. By manipulating these parameters, users can dynamically observe how the hyperbola's shape, orientation, and asymptotes change, deepening understanding of the relationship between algebraic parameters and geometric behavior. This resource is ideal for high school analytic geometry courses, introductory calculus sections on conic sections, or self-directed learners exploring conic properties.
GeoGebra Commands & Parameters
Numeric a(-5)(0, a)(0, (-a))Numeric b(2.9)y^(2) / a^(2) - x^(2) / b^(2) = 1
AI Drawing Prompt Reference
Create the graph of a hyperbola on a coordinate plane using its standard geometric form. Start by choosing the semi-transverse parameter a = -5, and mark the corresponding reference coordinates (0, a) and (0, -a) to reflect this value. Then choose the semi-conjugate parameter b = 2.9. Finally, plot the curve of all points (x, y) that satisfy the equation y^2/a^2 - x^2/b^2 = 1 on the same coordinate system, with the shape determined by the given a and b.
The prompt above was compiled from the original drawing commands and is for reference only.