
Logarithmic Functions Graphs
Loading the math board and drawing, please wait…
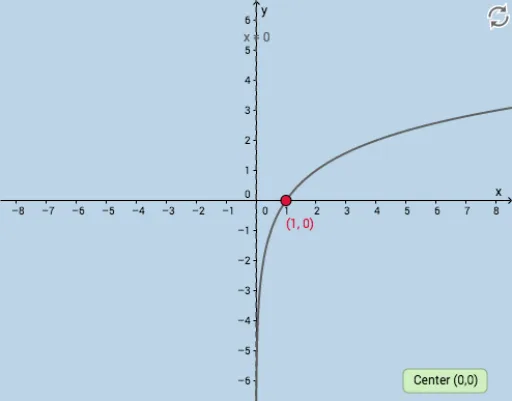
This example demonstrates the graphs of logarithmic functions. Key mathematical concepts include logarithmic functions. Using GeoGebra commands such as Textfield and objects a, k, c, d, button1, the graph of logarithmic functions can be constructed. Suitable for high school mathematics education and learning.
GeoGebra Commands & Parameters
Textfield(a) → InputBox1Textfield(c) → InputBox2Textfield(k) → InputBox3Textfield(d) → InputBox5
AI Drawing Prompt Reference
Create a graph demonstrating logarithmic functions. Include four adjustable input fields to control the base, vertical shift, horizontal stretch, and horizontal translation of the function. The main plot shows a smooth logarithmic curve with domain of positive x-values, rising or falling steeply near the y-axis and then leveling off. Clearly label the coordinate axes and include grid lines to observe changes. The overall style is clean and suitable for high school math education, emphasizing how the curve changes with parameter adjustments.
The prompt above was compiled from the original drawing commands and is for reference only.