
Logarithmic Function Parameters
Loading the math board and drawing, please wait…
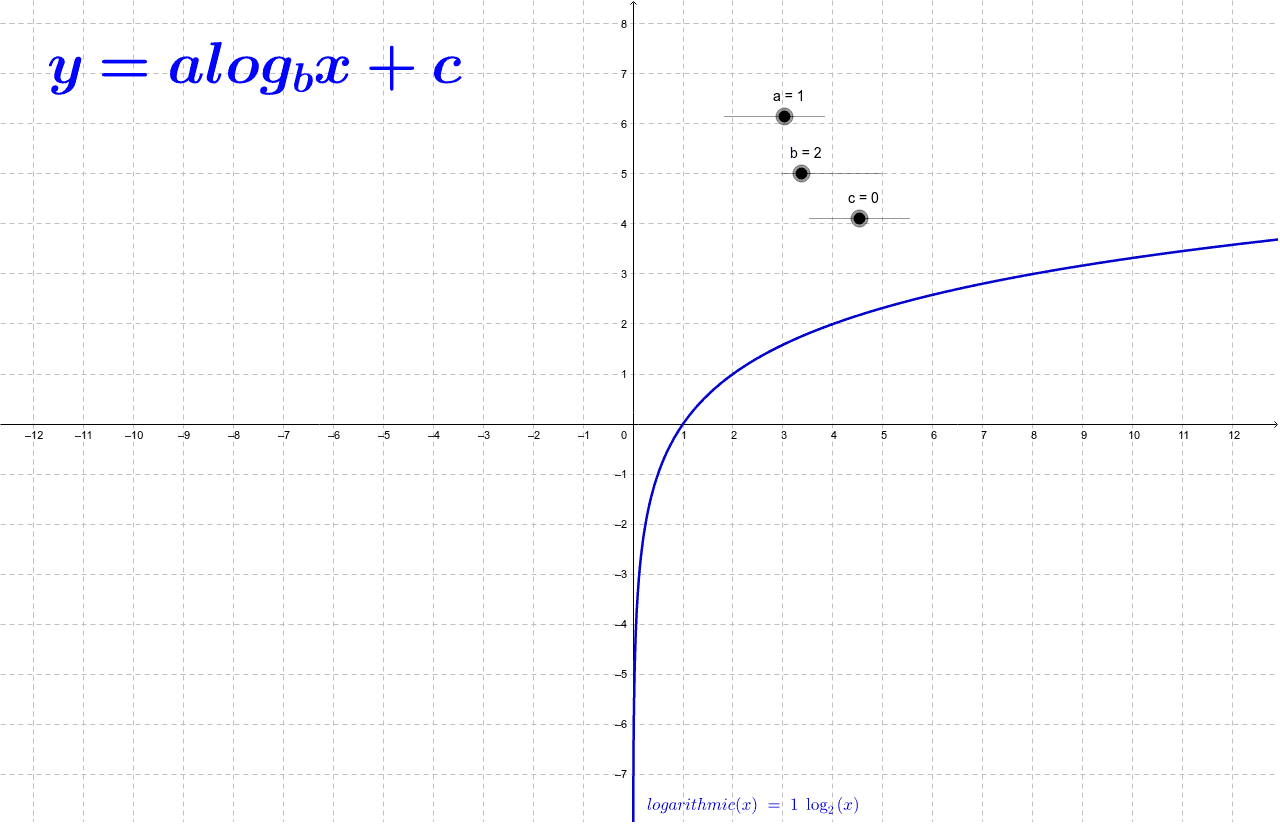
This example demonstrates how changing parameters a, b, c affects the logarithmic function's graph. It covers core math concepts like logarithmic function properties and parameter influence on the graph. Constructed using GeoGebra commands/objects: a, b, c, logarithmic, text1. Ideal for high school mathematics education to help students understand the transformation characteristics of logarithmic functions.
GeoGebra Commands & Parameters
Numeric a(1.0)Numeric b(2.0)Numeric c(0.0)logarithmic(x) = a * log(b, x) + c
AI Drawing Prompt Reference
Draw the graph of a logarithmic function with parameters a, b, c set to 1, 2, 0 respectively, showing the basic shape of the logarithmic function and labeling the values of a, b, c to observe how changes in these parameters affect the graph, helping to understand the influence of parameters on the function's shape and position.
The prompt above was compiled from the original drawing commands and is for reference only.