
Logarithmic Action (5)!: Dynamic Illustration of Two Inverse Properties of Logar
Loading the math board and drawing, please wait…
In collections
Exploring Exponential & Logarithmic Functions
Exploring Exponential & Logarithmic Functions
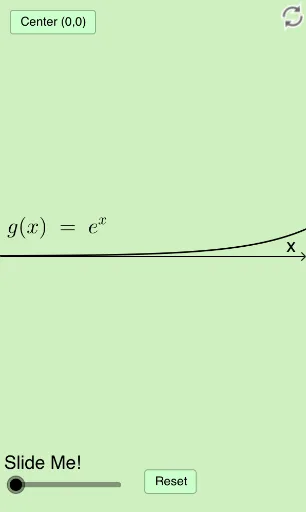
① This interactive GeoGebra example dynamically demonstrates two inverse properties of logarithms (such as the change-of-base formula and the inverse relationship between exponential and logarithmic functions) through a modifiable visual construction. ② Core mathematical concepts include logarithmic functions, exponential functions, inverse functions, symmetry of graphs, and algebraic identities. ③ Construction highlights: using GeoGebra commands such as Textfield, InputBox, Intersect, Dilate, Segment, Vector, Translate, and Rotate, the example builds multiple linked objects (e.g., f, a, C, M, t, J, O, d, r, etc.) to allow users to adjust parameters and observe how the properties hold. ④ Suitable for high school or pre-calculus students learning logarithms and exponentials, as well as for teachers demonstrating these concepts in class or for self-directed exploration of the symmetry and inverse relationships in logarithmic operations.
GeoGebra Commands & Parameters
Textfield(a) → InputBox1Textfield(f_1) → InputBox2Textfield(f) → InputBox3Intersect(f, h, 1) → EDilate(F, If[0 < d ≤ 1, 1 - d, 0], A) → F'Segment(F, F') → iDilate(A, If[1 < d ≤ 2, 2 - d, 0], B) → A'Segment(A, A') → jDilate(B, If[2 < d ≤ 3, 3 - d, 0], G) → B'Vector(B, B') → uTranslate(A, u) → A'_1Translate(A', u) → A''Segment(A'_1, A'') → j'Rotate(A'_1, If[3 < d ≤ 4, ((-(d - 3)) * π / 2), ((-π)) / 2], F) → HRotate(A'', If[3 < d ≤ 4, ((-(d - 3)) * π / 2), ((-π)) / 2], F) → A'''Segment(H, A''') → j''Rotate(A'_1, If[3 < d ≤ 4, ((d - 3) * π / 2), π / 2], F) → IRotate(A'', If[3 < d ≤ 4, ((d - 3) * π / 2), π / 2], F) → A'''_1Dilate(D, If[4 < d ≤ 5, 5 - d, 0], E) → D'Segment(D, D') → lDilate(A, If[1 < d ≤ 2, 2 - d, 0], C) → A'_2Segment(A, A'_2) → mDilate(C, If[2 < d ≤ 3, 3 - d, 0], J) → C'Vector(C, C') → vTranslate(A, v) → A'_3Translate(A'_2, v) → KSegment(A'_3, K) → m'Rotate(A'_3, If[3 < d ≤ 4, ((-(d - 3)) * π / 2), ((-π)) / 2], F) → LRotate(K, If[3 < d ≤ 4, ((-(d - 3)) * π / 2), ((-π)) / 2], F) → K'Segment(L, K') → m''Intersect(f, p, 1) → NDilate(M, If[4 < d ≤ 5, 5 - d, 0], Q) → M'Segment(M, M') → qRotate(F, If[5 < d ≤ 6, ((d - 5) * π / 2), π / 2], F) → F'_1Rotate(F', If[5 < d ≤ 6, ((d - 5) * π / 2), π / 2], F) → F''Segment(F'_1, F'') → i'Dilate(F, If[6 < d ≤ 7, 7 - d, 0], M) → F'_2Vector(F, F'_2) → wTranslate(F'_1, w) → PTranslate(F'', w) → F'''Segment(P, F''') → i''
AI Drawing Prompt Reference
Create a dynamic illustration showing the inverse properties of logarithms, including logarithmic and exponential function graphs to demonstrate their inverse relationship and symmetry. The graph features adjustable parameters where users can change values using sliders to observe the transformation of the logarithmic function graph, intersection points with the exponential function graph, and symmetry. The illustration includes multiple interconnected objects such as function graphs, intersection points, line segments, and vectors, which transform and move to visually demonstrate the properties of logarithmic functions and their inverse operations.
The prompt above was compiled from the original drawing commands and is for reference only.