
Logarithm Exploration
Loading the math board and drawing, please wait…
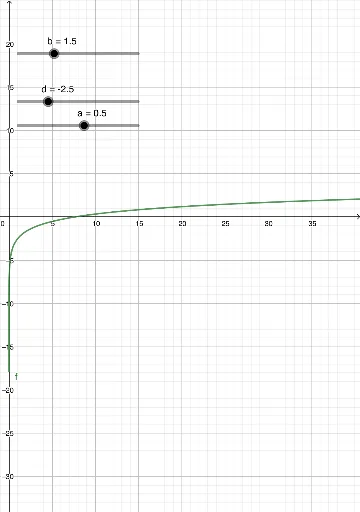
This example demonstrates the basic properties and graphs of logarithmic functions. It involves core concepts of logarithms and uses GeoGebra objects like b, d, a, f to construct the graph. Suitable for high school math education and learning.
GeoGebra Commands & Parameters
Numeric b(1.5)Numeric d(-2.5)Numeric a(0.5)f(x) = (a * log(b, x)) + d
AI Drawing Prompt Reference
Draw a logarithmic function graph with base 1.5, coefficient 0.5, and vertical shift -2.5. First, set the base b to 1.5, then set the coefficient a to 0.5, and finally set the vertical shift d to -2.5. Construct the function f(x) = (0.5 * log(1.5, x)) - 2.5 based on these parameters.
The prompt above was compiled from the original drawing commands and is for reference only.