
Locus of the vertex as b varies
Loading the math board and drawing, please wait…
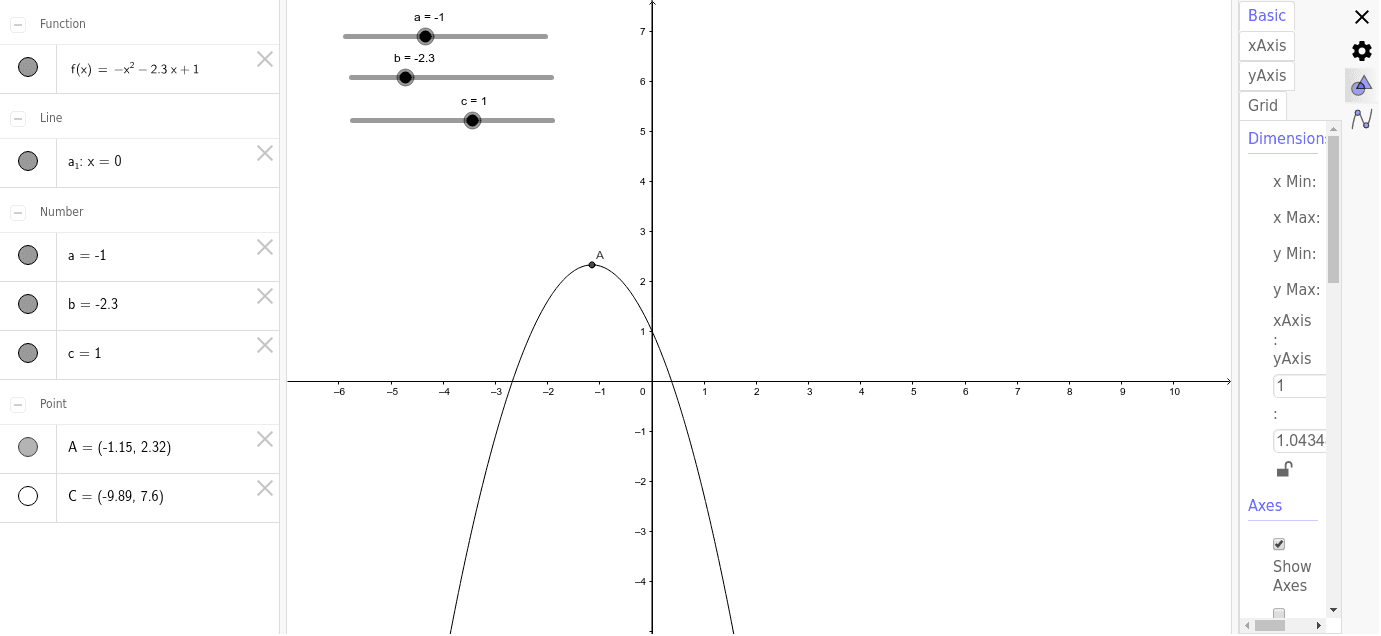
This example demonstrates the path traced by the vertex of a parabola as the coefficient b varies. It involves core math concepts like parabolas, function graphs, and locus. Constructed using GeoGebra objects c, b, a, f, a_1, C, A. Suitable for high school mathematics education to understand the impact of parameter changes on function graphs.
GeoGebra Commands & Parameters
Numeric c(1)Numeric b(-2.3)Numeric a(-1)f(x) = (a * x^(2)) + (b * x) + cLine a_1(12, 0, 0)Point C(-9.89, 7.6)(((-b)) / 2 / a, f(((-b)) / 2 / a))
AI Drawing Prompt Reference
Draw the locus of the vertex of a parabola as the coefficient b varies from -2.3 to 1, with a = -1 and c = 1. Include the x-axis, mark a point on the locus at the vertex of the parabola, and show the parabola changing as b varies to illustrate the impact of parameter changes on the function graph.
The prompt above was compiled from the original drawing commands and is for reference only.