
Location and Spread of Data Set
Loading the math board and drawing, please wait…
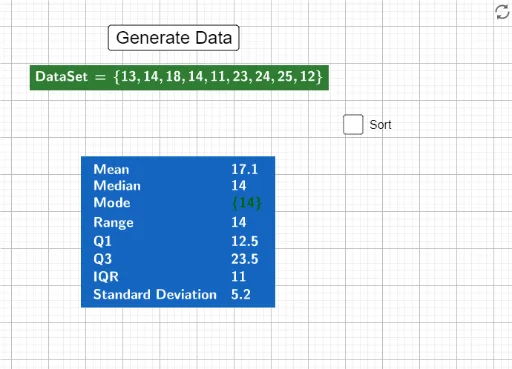
This example demonstrates the average and spread of a data set. It involves concepts like arithmetic mean and standard deviation. Using GeoGebra commands such as Random, mean, Median, etc., it constructs a data set and analyzes its distribution characteristics. Suitable for middle school mathematics education and learning.
GeoGebra Commands & Parameters
Random(-4, 18) → amean(DataSet) → bMedian(DataSet) → cMode(DataSet) → dQ1(DataSet) → fQ3(DataSet) → gTableText({"Mean", b}, {"Median", c}, {"Mode", d}, {"Range", e}, {"Q1", f}, {"Q3", g}, {"IQR", h}, {"Standard Deviation", i}) → text1LaTeX(DataSet, true, true) → text2Sort(DataSet) → SortedDataLaTeX(SortedData, true, true) → text3
AI Drawing Prompt Reference
Create a visual representation of a dataset showing its central tendency and spread. Generate a random set of numbers, then compute and display the arithmetic mean, median, mode, quartiles, range, interquartile range, and standard deviation. Present these statistics in a table, and show both the original and sorted data in formula format. The layout should be clear for educational purposes, suitable for middle school statistics lessons.
The prompt above was compiled from the original drawing commands and is for reference only.