
Lines and Parabolas
Loading the math board and drawing, please wait…
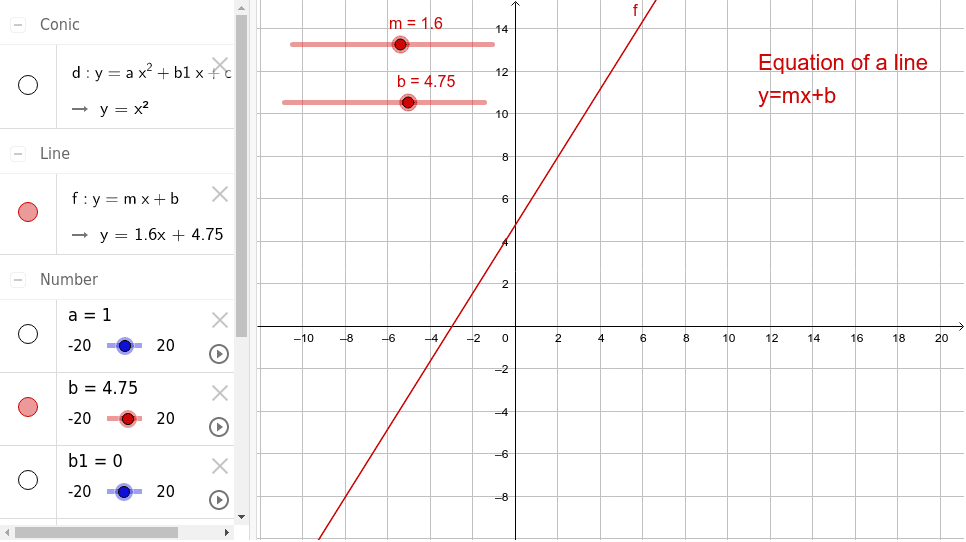
This example demonstrates the intersection points between lines and parabolas, showing dynamic changes as parameters vary. Key math concepts include coordinate geometry, function graphing, symmetry, and parameter manipulation. Construction highlights involve GeoGebra commands like creating text objects (text1), slope (m), y-intercept (b), parabolic function (f), parameters (a, b1, c, d), and auxiliary text (text2). Suitable for high school mathematics education to understand function intersections, parameter effects, and geometric intuition.
GeoGebra Commands & Parameters
Numeric m(1.6)Numeric b(4.75)y = (m * x) + bNumeric a(1)Numeric b1(0)Numeric c(0)y = (a * x^(2)) + (b1 * x) + c
AI Drawing Prompt Reference
Draw a straight line with slope 1.6 and y-intercept 4.75. Also draw a parabola that opens upward with quadratic coefficient 1, linear coefficient 0, and constant term 0, so its vertex is at the origin. Mark the intersection points between the line and the parabola. Display the values of the slope, intercept, and the parabola's parameters. As these parameters vary, the intersection points move, illustrating the geometric relationship between a line and a parabola.
The prompt above was compiled from the original drawing commands and is for reference only.