
Linear Programming Problem 1
Loading the math board and drawing, please wait…
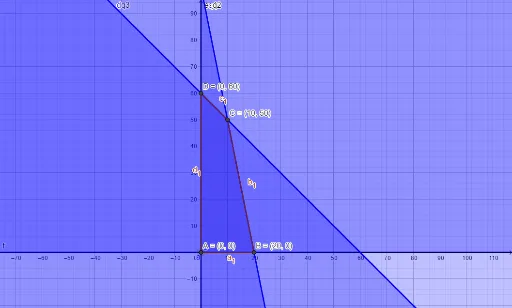
This example demonstrates the solution process of a linear programming problem through graphical representation, highlighting the search for the optimal solution. Key mathematical concepts include linear inequalities, feasible regions, and optimal solutions. It utilizes GeoGebra commands and objects such as Intersect (intersection points) and Polygon (polygons) as outlined in the construction summary. Suitable for high school and above mathematics learners for understanding and practicing the application of linear programming.
GeoGebra Commands & Parameters
Intersect(eq1, f) → AIntersect(f, eq2) → BIntersect(eq2, eq3) → CIntersect(eq3, eq1) → DPolygon(A, B, C, D) → q1, a_1, b_1, c_1, d_1
AI Drawing Prompt Reference
Draw a graph for a linear programming problem including three lines, their feasible region formed by the intersection of these lines, and label the intersection points of the lines. Finally, connect these points to form a quadrilateral to show the search process for the optimal solution.
The prompt above was compiled from the original drawing commands and is for reference only.