
Linear Programming Example: Picturing Pictures
Loading the math board and drawing, please wait…
In collections
Geom. & Alg.: Systems Equations & Linear Programming
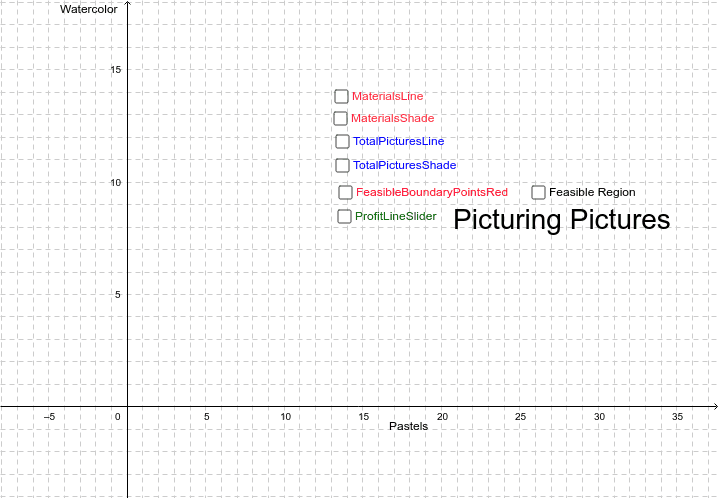
This example demonstrates maximizing profit under inequality constraints using linear programming, visually showing the feasible region and optimal solution. Core math concepts include inequalities, matrices, quadratic functions, hyperbolas, and parabolas. Construction highlights GeoGebra commands: Intersect, Point, Polygon. Suitable for high school and above learners to understand linear programming applications and geometric interpretations.
GeoGebra Commands & Parameters
Intersect(Materials, TotalPics) → AIntersect(Materials, yAxis) → BIntersect(Materials, xAxis) → CIntersect(TotalPics, yAxis) → DIntersect(TotalPics, xAxis) → EIntersect(yAxis, xAxis) → FPoint(yAxis) → GPoint(xAxis) → IIntersect(xAxis, yAxis) → JPolygon(G, H, I, J) → poly1, g, h, i, j
AI Drawing Prompt Reference
Create a linear programming example to visualize maximizing profit under inequality constraints. Draw the x and y axes, then plot two lines in the first quadrant to represent the inequality constraints, filling the area bounded by these lines and the axes to show the feasible region. Plot a quadratic or hyperbolic curve representing the profit function within the feasible region, identifying its intersection with the region as the optimal solution. Mark points on the x and y axes for material usage and product quantity, connecting them to the optimal solution to complete the illustration.
The prompt above was compiled from the original drawing commands and is for reference only.