
Linear Functions Practice by Hege Katrine Engenes
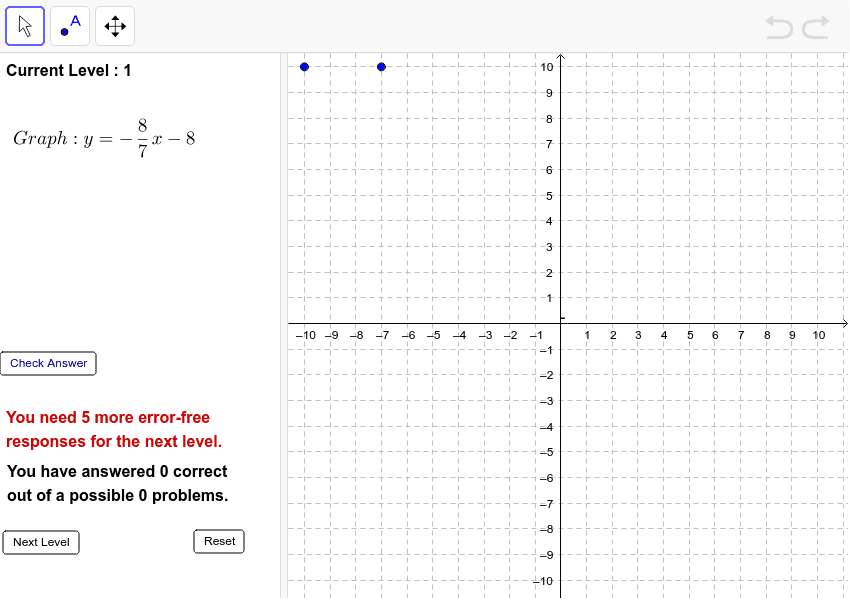
Loading the math board and drawing, please wait…
In collections
Linear equations
This example demonstrates the graph and properties of linear functions. Core math concepts include linear functions, slope, and coordinate geometry. It uses GeoGebra commands and objects like RandomElement, Line, Random, Cell, Textfield, If, FractionText, Slope, Text. Suitable for middle school and above students to practice linear function knowledge, ideal for classroom teaching or homework reinforcement.
GeoGebra Commands & Parameters
RandomElement({-8, -7, -6, -5, -4, -3, -2, -1, 1, 2, 3, 4, 5, 6, 7, 8}) → aRandomElement({-8, -7, -6, -5, -4, -3, -2, -1, 1, 2, 3, 4, 5, 6, 7, 8}) → bRandomElement({-8, -7, -6, -5, -4, -3, -2, -1, 1, 2, 3, 4, 5, 6, 7, 8}) → cRandomElement({-8, -7, -6, -5, -4, -3, -2, -1, 1, 2, 3, 4, 5, 6, 7, 8}) → dLine(G, H) → nLine(E, B) → kLine(A, B) → eLine(C, D) → hRandom(1, 20) → n1Random(1, 20) → n2Random(1, 20) → n3Random(1, 20) → n4Random(1, 20) → n5Random(1, 20) → nxCell(2, ActualLevel + 1) → LevelTotalTextfield(AnswerNum) → inputBox1If(e ≟ h ∧ g ∧ (C ≠ D), true, false) → C2If(e ≟ h ∧ g ∧ ActualLevel ≟ 2, true, false) → C3If(e ≟ j ∧ ActualLevel ≟ 3 ∧ g, true, false) → C4If(e ≟ j ∧ ActualLevel ≟ 4 ∧ g, true, false) → C5If(k ≟ j ∧ ActualLevel ≟ 5 ∧ g, true, false) → C6If(k ≟ j ∧ ActualLevel ≟ 6 ∧ g, true, false) → C7If(j ≟ n ∧ ActualLevel ≟ 7 ∧ g, true, false) → C8FractionText(abs(y(B) / x(A))) → text1If(y(B) < 0, "-", "+") → Text3If(y(B) / x(A) > 0, "-", "") → text4Textfield(j) → inputBox2FractionText(abs(y(B) / x(A))) → absslopeSlope(k) → mFractionText(abs(m)) → text8Text(If[m < 0, "-", ""]) → text9If((C2 ≟ false ∧ ActualLevel ≟ 1 ∨ C3 ≟ false ∧ ActualLevel ≟ 2 ∨ C4 ≟ false ∧ ActualLevel ≟ 3 ∨ C5 ≟ false ∧ ActualLevel ≟ 4 ∨ C6 ≟ false ∧ ActualLevel ≟ 5 ∨ C7 ≟ false ∧ ActualLevel ≟ 6 ∨ C8 ≟ false ∧ ActualLevel ≟ 7) ∧ g, true, false) → AnswerWrongIf(C2 ≟ true ∧ ActualLevel ≟ 1 ∨ C3 ≟ true ∧ ActualLevel ≟ 2 ∨ C4 ≟ true ∧ ActualLevel ≟ 3 ∨ C5 ≟ true ∧ ActualLevel ≟ 4 ∨ C6 ≟ true ∧ ActualLevel ≟ 5 ∨ C7 ≟ true ∧ ActualLevel ≟ 6 ∨ C8 ≟ true ∧ ActualLevel ≟ 7, true, false) → AnswerCorrectRandomElement({-8, -7, -6, -5, -4, -3, -2, -1, 1, 2, 3, 4, 5, 6, 7, 8}) → o
AI Drawing Prompt Reference
Draw two randomly generated lines to demonstrate the graph and properties of linear functions. First, determine the random starting and ending points for the two lines, then draw them. Next, calculate and display the slope of one of the lines, labeling it with text. Finally, indicate the sign of the slope with different symbols in the graph and ask the user to determine if the two lines are parallel, completing the practice exercise on linear functions.
The prompt above was compiled from the original drawing commands and is for reference only.