
Linear Functions - Point-Slope form - Practice
Loading the math board and drawing, please wait…
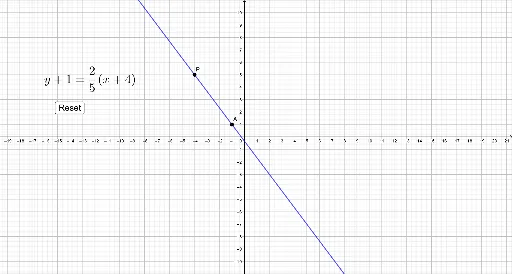
This example demonstrates how to graph linear functions using the point-slope form equation. It involves core math concepts like point-slope form, linear functions, slope, and coordinate geometry. Key GeoGebra commands and objects used include Random, If, Line, Intersect, Slope, and elements like eq1, P_{y}, P_{x}, etc., for interactive graphing and understanding dynamic points. Suitable for high school students practicing function graphing and point-slope form applications.
GeoGebra Commands & Parameters
Random(-5, 5) → P_{y}Random(-5, 5) → P_{x}Random(-5, 5) → dyRandom(1, 5) → dxIf(dy ≠ 0, dy / dx, (dy + 1) / dx) → mLine(A, B) → fIntersect(f, x = 0) → b_{temp}Slope(f) → m_{0}Random(-5, 5) → b
AI Drawing Prompt Reference
Draw a line using the point-slope form. First, randomly select a y-coordinate for a point, then an x-coordinate, and determine the slope of the line. Next, draw the line and find its intersection with the y-axis, and finally, determine the y-intercept.
The prompt above was compiled from the original drawing commands and is for reference only.