
Linear Function Transformation Exploration
Loading the math board and drawing, please wait…
In collections
Transforming Functions
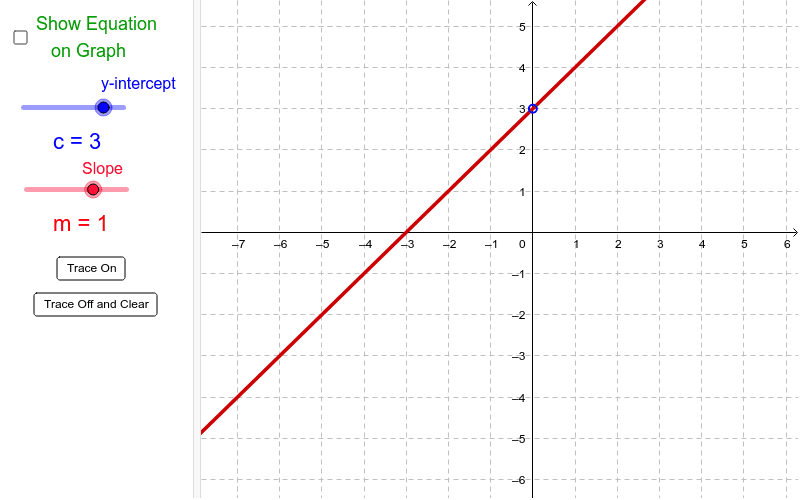
This example demonstrates how changing the slope m and y-intercept c in a linear equation affects its graph. Key math concepts include linear functions, function graph transformations, and the impact of parameters on function graphs. It is constructed using the Line command for graphing, slider objects for interactive parameter manipulation, and text objects to display parameter values and function expressions. Suitable for high school students to understand translations and scalings of linear function graphs, as well as for teaching function transformations.
GeoGebra Commands & Parameters
Line(D, E) → a
AI Drawing Prompt Reference
Draw a linear function graph that changes by sliding the slope and y-intercept, showing the function graph with a line and labeling the parameter values and function expressions with text to explore the impact of parameters on the graph.
The prompt above was compiled from the original drawing commands and is for reference only.