
Linear Function Graphing Tool
Loading the math board and drawing, please wait…
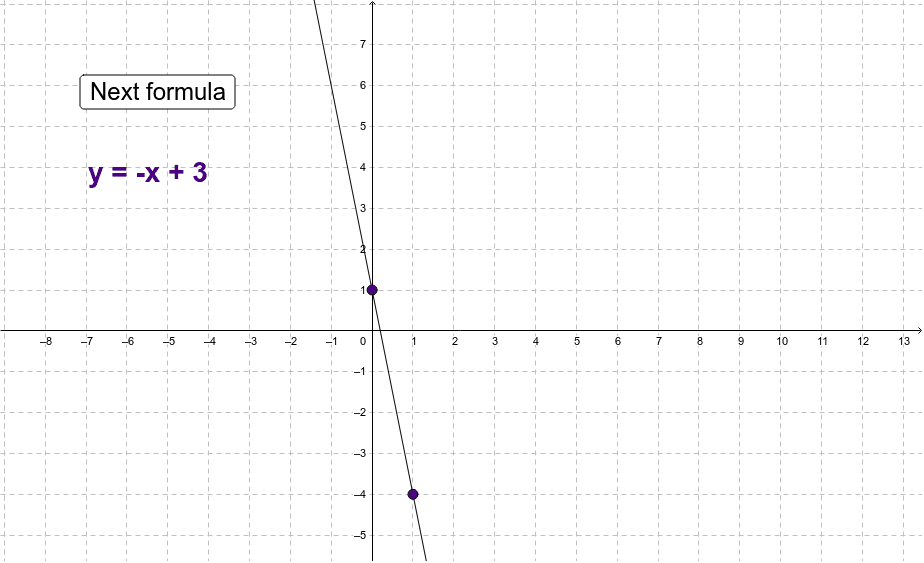
This example demonstrates how to plot the graph of a linear function. Core math concepts include linear functions, coordinate geometry, and graphing techniques. Construction highlights: utilizes GeoGebra commands Random (random number generation) and Line (line plotting); objects such as a, b, c, poga1, teksts1, A, B, teksts2, m, n, o, p, d are involved. Suitable for middle school and above students as a self-assessment tool to understand linear function graphing methods.
GeoGebra Commands & Parameters
Random(-5, 5) → aRandom(-5, 5) → bLine(B, A) → d