
Linear Function Explorer
Loading the math board and drawing, please wait…
In collections
Students' linear functions
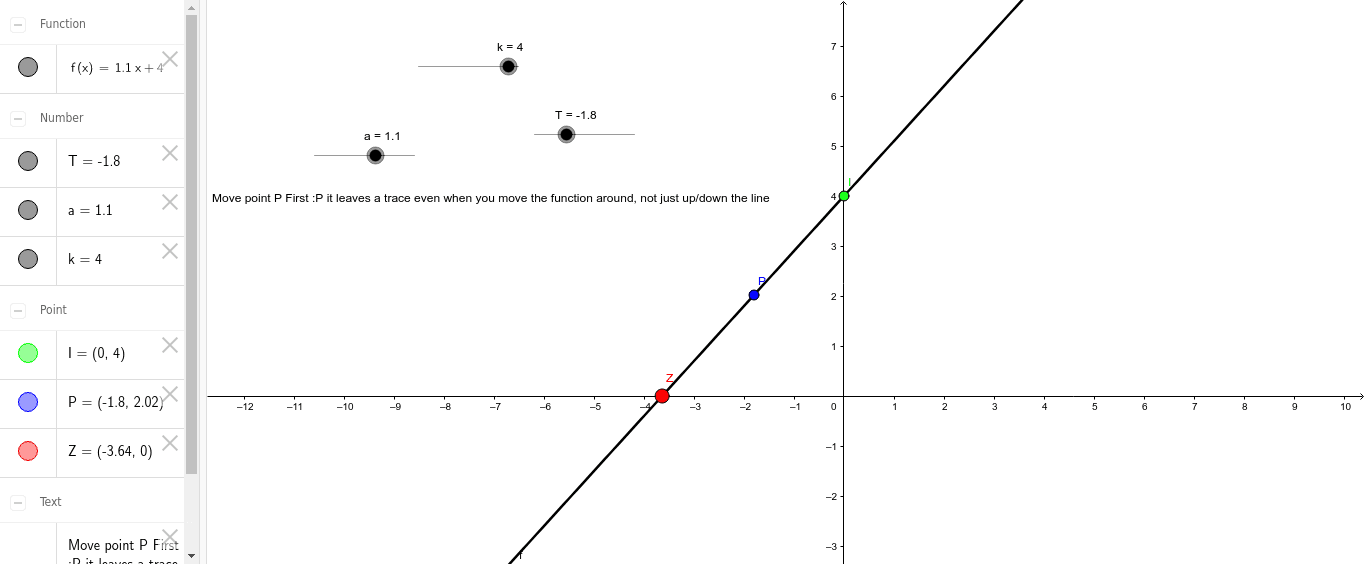
This example demonstrates the graph of a linear function y=kx+a and its variations. Core math concepts include linear functions, slope (k), y-intercept (a), function graphs, statistical characteristics, roots, and optimization problems. It uses GeoGebra commands/objects: sliders a and k, function f, points T, P, Z, I, and text object text1. Suitable for high school mathematics teaching to explore the properties of linear functions and the impact of parameters.
GeoGebra Commands & Parameters
Numeric a(1.1)Numeric k(4.0)f(x) = a * x + kNumeric T(-1.8)(T, a * T + k)((-k) / a, 0)(0, a * 0 + k)
AI Drawing Prompt Reference
Draw the graph of a linear function with adjustable slope and y-intercept using sliders. Display the function graph and its variations as the parameters change. Mark the origin, y-intercept, and x-intercept on the coordinate system and connect these key points. Include text labels showing the values of the slope and y-intercept to observe their effects on the function graph.
The prompt above was compiled from the original drawing commands and is for reference only.