
Linear Equation
Loading the math board and drawing, please wait…
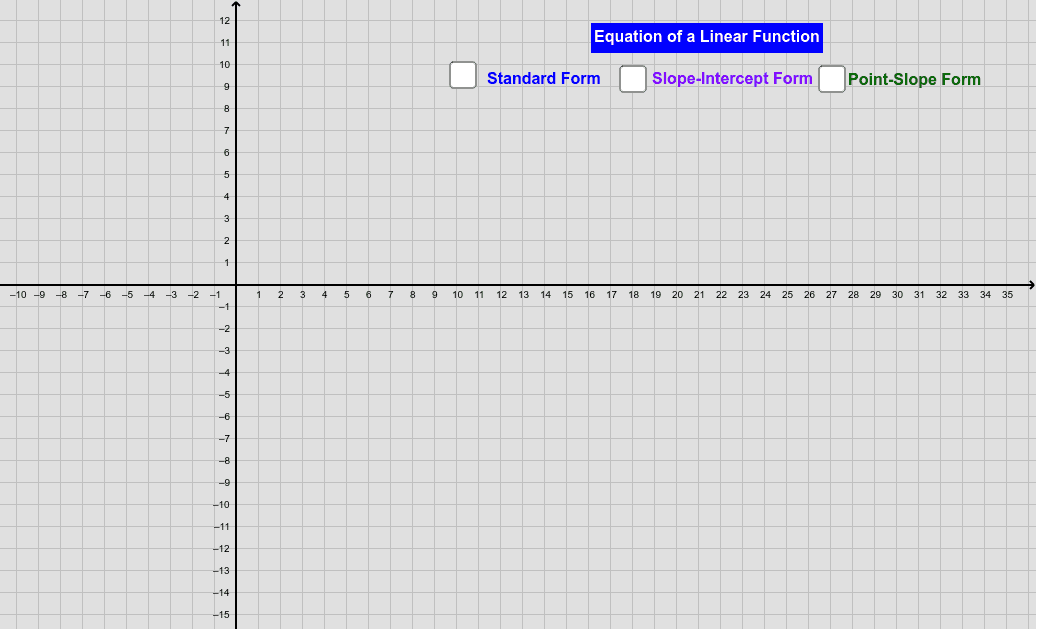
This example demonstrates the graphical representation of a linear equation. It involves the core mathematical concept of a linear function and its graph. Using GeoGebra commands such as Intersect, Line, and OrthogonalLine, the graph of a linear function can be constructed, and its intersections with the coordinate axes can be found. Suitable for students at the middle school level and above to learn about linear functions.
GeoGebra Commands & Parameters
Intersect(a, yAxis) → DIntersect(a, xAxis) → ELine(D, E) → b_1Intersect(c, yAxis) → FOrthogonalLine(G, xAxis) → eOrthogonalLine(F, yAxis) → fIntersect(e, f) → HVector(F, H) → uVector(H, G) → vMidpoint(H, G) → IMidpoint(H, F) → JOrthogonalLine(P, xAxis) → gOrthogonalLine(K, g) → hIntersect(g, h) → LVector(P, L) → wVector(L, K) → iMidpoint(L, K) → MMidpoint(L, P) → N