
Linear Equation Picture Drawing
Loading the math board and drawing, please wait…
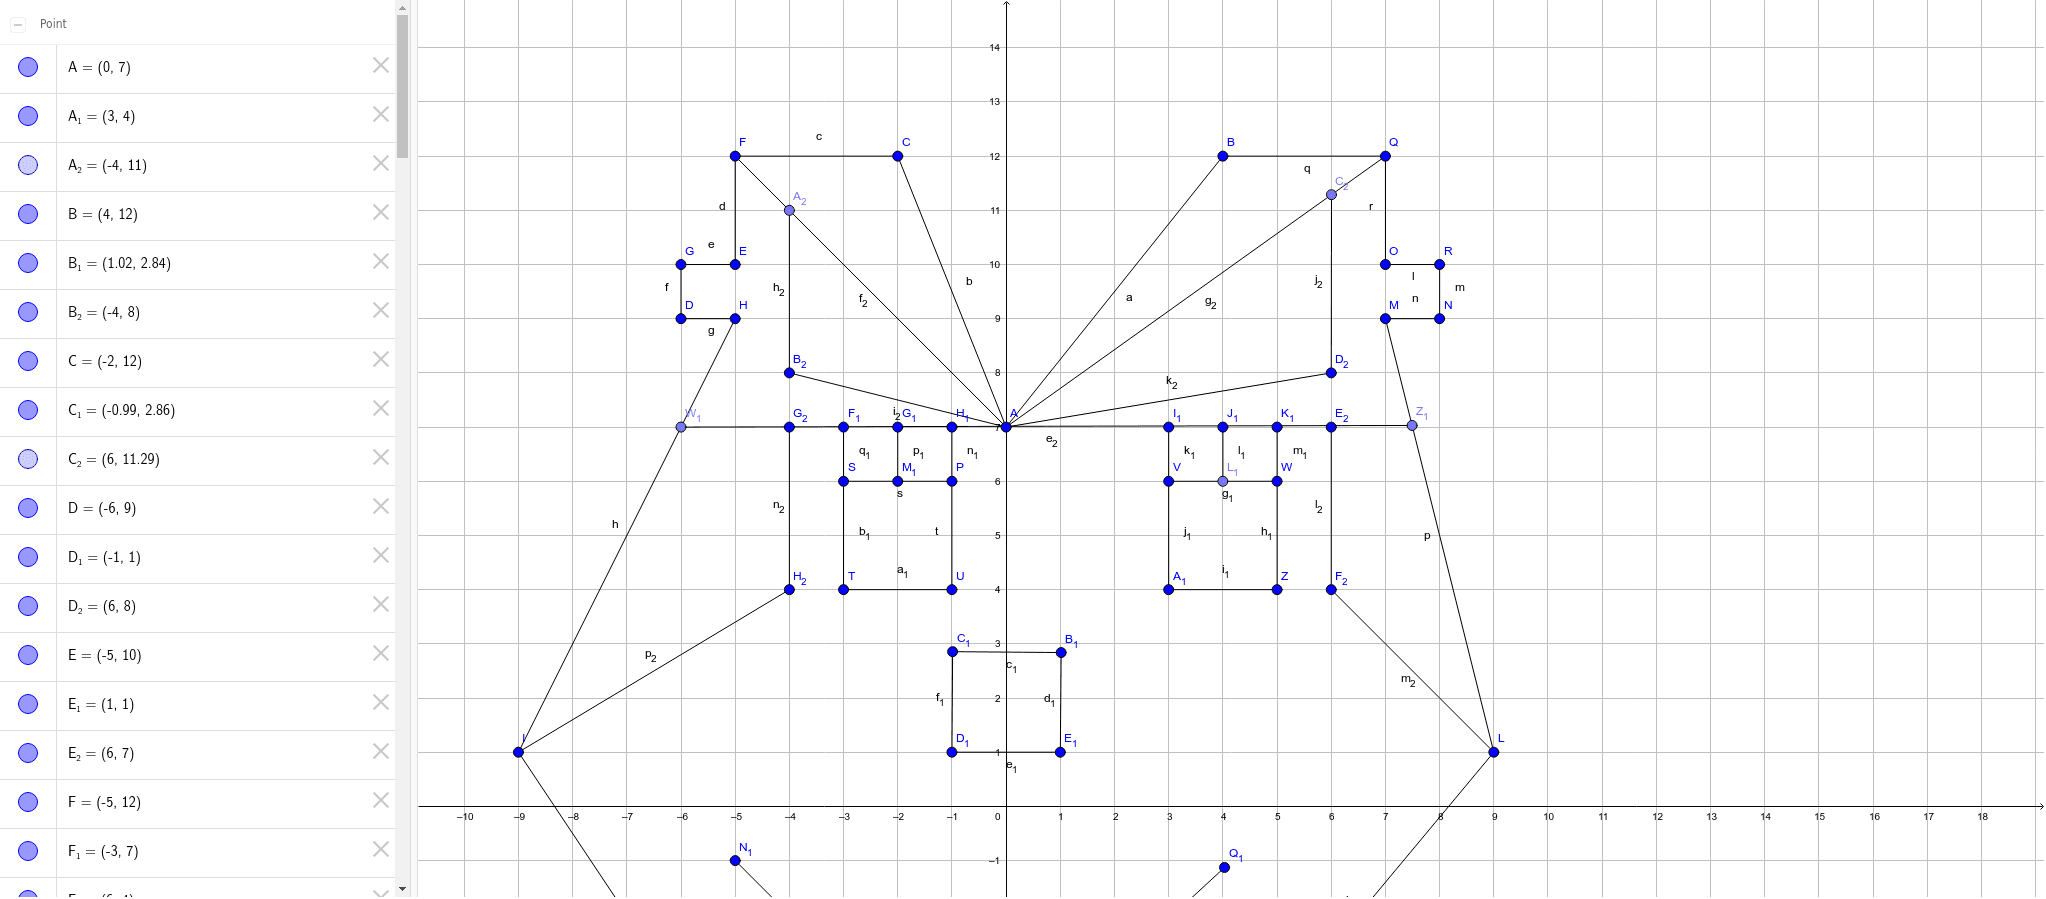
This example demonstrates how to draw the graph of a linear equation using GeoGebra and illustrates its geometric meaning. Core math concepts include linear equations, coordinate geometry, and geometric construction. Key construction points involve using GeoGebra commands/objects like Segment (line segment) and Point (point) as derived from the 'Construction Summary'. Suitable for high school mathematics teaching or student self-exploration of linear equation graph properties.
GeoGebra Commands & Parameters
Segment(A, B) → aSegment(A, C) → bSegment(C, F) → cSegment(F, E) → dSegment(E, G) → eSegment(G, D) → fSegment(D, H) → gSegment(H, I) → hSegment(I, J) → iSegment(J, K) → jSegment(L, K) → kSegment(M, L) → pSegment(B, Q) → qSegment(Q, O) → rSegment(O, R) → lSegment(N, R) → mSegment(N, M) → nSegment(S, P) → sSegment(P, U) → tSegment(U, T) → a_1Segment(T, S) → b_1Segment(C_1, B_1) → c_1Segment(B_1, E_1) → d_1Segment(D_1, E_1) → e_1Segment(C_1, D_1) → f_1Segment(V, W) → g_1Segment(W, Z) → h_1Segment(Z, A_1) → i_1Segment(A_1, V) → j_1Segment(V, I_1) → k_1Point(g_1) → L_1Segment(L_1, J_1) → l_1Segment(W, K_1) → m_1Segment(P, H_1) → n_1Segment(M_1, G_1) → p_1Segment(S, F_1) → q_1Segment(N_1, O_1) → r_1Segment(O_1, P_1) → s_1Segment(Q_1, P_1) → t_1Segment(P_1, R_1) → a_2Segment(O_1, S_1) → b_2Point(yAxis) → U_1Segment(T_1, U_1) → c_2Segment(U_1, V_1) → d_2Point(h) → W_1Point(p) → Z_1Segment(W_1, Z_1) → e_2Segment(F, A) → f_2Segment(A, Q) → g_2Point(f_2) → A_2Segment(A_2, B_2) → h_2Segment(B_2, A) → i_2Point(g_2) → C_2Segment(C_2, D_2) → j_2Segment(D_2, A) → k_2Segment(E_2, F_2) → l_2Segment(F_2, L) → m_2Segment(G_2, H_2) → n_2Segment(H_2, I) → p_2