
Line Segment and Function Demonstration
Loading the math board and drawing, please wait…
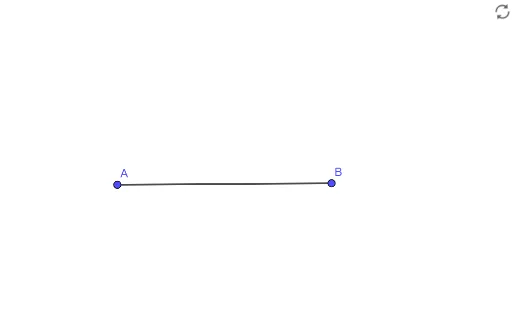
This example demonstrates how to draw the graph of function f on line segment AB and show its relationship with the segment. Core math concepts include line segment, function graph, and analytical geometry. It uses GeoGebra commands Segment for constructing points A, B, and object f for the function. Suitable for high school mathematics teaching, focusing on the integration of functions and geometric shapes.
GeoGebra Commands & Parameters
Segment(A, B) → f
AI Drawing Prompt Reference
Draw a line segment AB and then plot the graph of function f on it to show the relationship between the segment and the function. First, draw the line segment AB, and then plot the function f based on the points on the segment.
The prompt above was compiled from the original drawing commands and is for reference only.