
Limits at Infinity and Infinite Limits
Loading the math board and drawing, please wait…
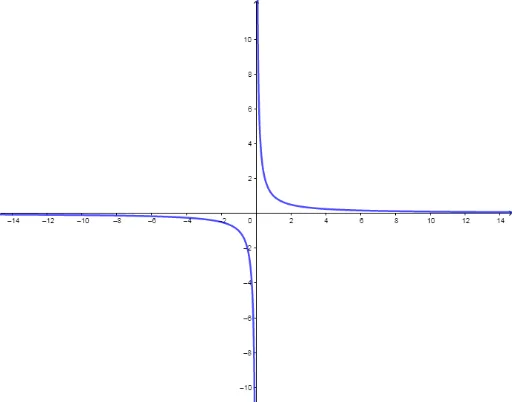
This example demonstrates the concepts of limits at infinity and infinite limits. By plotting functions f, g, and h, it shows how the function values change as the independent variable approaches infinity or negative infinity. Key mathematical concepts include limits, function graphs, and the range of the independent variable. Multiple GeoGebra commands are used, such as constructing functions, slider animations, and loci. Suitable for high school mathematics education and learning.
GeoGebra Commands & Parameters
f: y = 1 / xg: y = 1 / (x + 5)^(2)h(x) = If[x < 4, 1 / (x - 4)]p(x) = If[x > 4, -1 / (x - 4) + 3]truefalseNumeric n(1)Numeric c(0.99)falsefalsefalsefalsefalsefalse((2 * c) - 2, 1 / ((2 * c) - 2))((-2 * c) + 2, 1 / ((-2 * c) + 2))(c - 6, 1 / (c - 6 + 5)^(2))((-c) - 4, 1 / ((-c) - 4 + 5)^(2))(c + 3, 1 / (c + 3 - 4))((-c) + 5, -1 / ((-c) + 5 - 4) + 3)q(x) = If[x < 0, ((-3 * x^(2)) + 7) / (x^(2) + 2)]r(x) = If[x > 0, (0.002 * x^(3)) + 7 / 2]((-7.5 * c) - 7.5, ((-3 * ((-7.5 * c) - 7.5)^(2)) + 7) / (((-7.5 * c) - 7.5)^(2) + 2))((7.5 * c) + 7.5, (0.002 * ((7.5 * c) + 7.5)^(3)) + 7 / 2)s(x) = (4 * x / (x^(2) + 1))((-7.5 * c) - 7.5, (4 * ((-7.5 * c) - 7.5) / (((-7.5 * c) - 7.5)^(2) + 1)))((7.5 * c) + 7.5, (4 * ((7.5 * c) + 7.5) / (((7.5 * c) + 7.5)^(2) + 1)))t(x) = If[x < 0, (4 * x / (x^(2) + 5))]f_1(x) = If[x > 0, (4 * x^(2) / (x^(2) + 5))]((-7.5 * c) - 7.5, t((-7.5 * c) - 7.5))((7.5 * c) + 7.5, f_1((7.5 * c) + 7.5))
AI Drawing Prompt Reference
Plot the graphs of three functions: y=1/x, y=1/(x+5)^2, and a piecewise function y=1/(x-4) for x<4 and y=-1/(x-4)+3 for x>4, demonstrating their behavior at infinity and infinite limits. Use slider animations to show how the function values change and draw locus points to illustrate the trends and limit behaviors of the functions as they approach positive and negative infinity.
The prompt above was compiled from the original drawing commands and is for reference only.