
Limits and Continuity Exercise 7.4.1
Loading the math board and drawing, please wait…
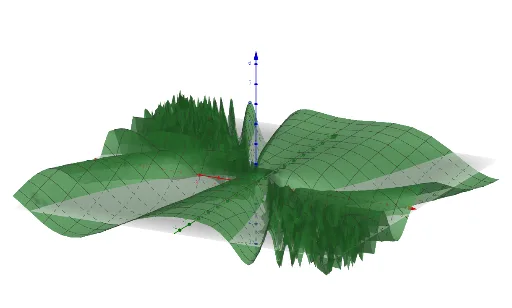
This example demonstrates how to use GeoGebra to plot the limits and continuity of a function, involving core mathematical concepts such as limits, continuity, derivatives, special points, and circles. Construction highlights include using GeoGebra commands/objects like G. Suitable for high school and above mathematics learners and teachers to understand and demonstrate basic calculus concepts.
GeoGebra Commands & Parameters
G(x, y) = sin((x^(2) + y) / (x + y))