
Limits and Continuity by Ku, Yin Bon (Albert)
Loading the math board and drawing, please wait…
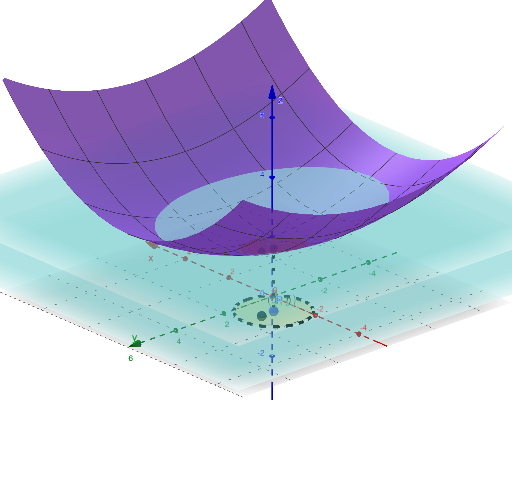
This example dynamically demonstrates the concept of limits and continuity at a point for a function, visually illustrating the ε-δ definition of limits and the geometric meaning of continuity. Core mathematical concepts include the ε-δ definition of limits, continuity, function graphs, and dynamic point tracking. GeoGebra commands and objects like PointIn, Circle, Segment, Vector, Line, and Textfield are used to achieve dynamic point P approaching point c, with ε-δ circles changing dynamically. Suitable for high school students and above, or as a teaching tool for university-level calculus demonstrations.
GeoGebra Commands & Parameters
PointIn(z = 0) → PCircle(P, δ, xOyPlane) → cSegment(P, Q) → gVector((0, 0, 1)) → uLine(P, u) → hTextfield(f) → InputBox1PointIn(b) → ATextfield(L) → InputBox2