
Limit and Function Graph Demo
Loading the math board and drawing, please wait…
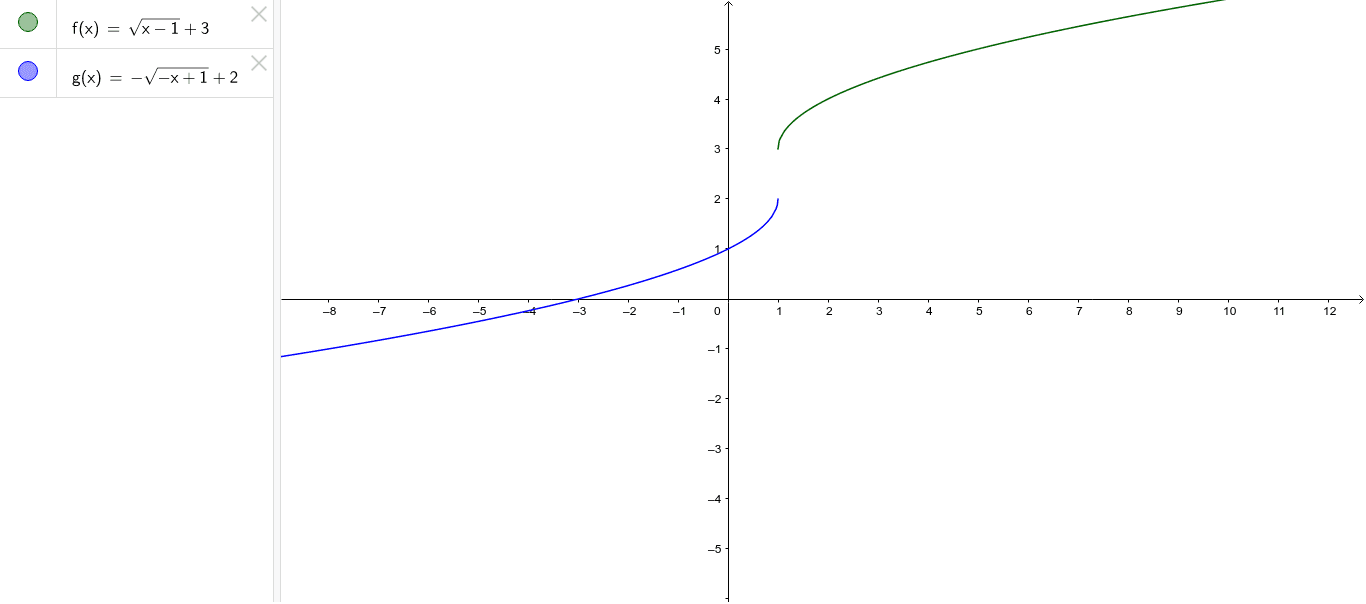
This example dynamically demonstrates the limits and intersection points of two functions, f and g, visually illustrating the concept of limits and their relation to function graphs. Core math concepts include limits, intersection, real numbers, difference and slope, step functions, and fractal geometry. It is constructed using GeoGebra commands to plot functions and calculate intersections. Suitable for high school and above learners to understand limit operations and function properties.
GeoGebra Commands & Parameters
f(x) = sqrt(x - 1) + 3g(x) = (-sqrt((-x) + 1)) + 2