
Function Limit Demonstration
Loading the math board and drawing, please wait…
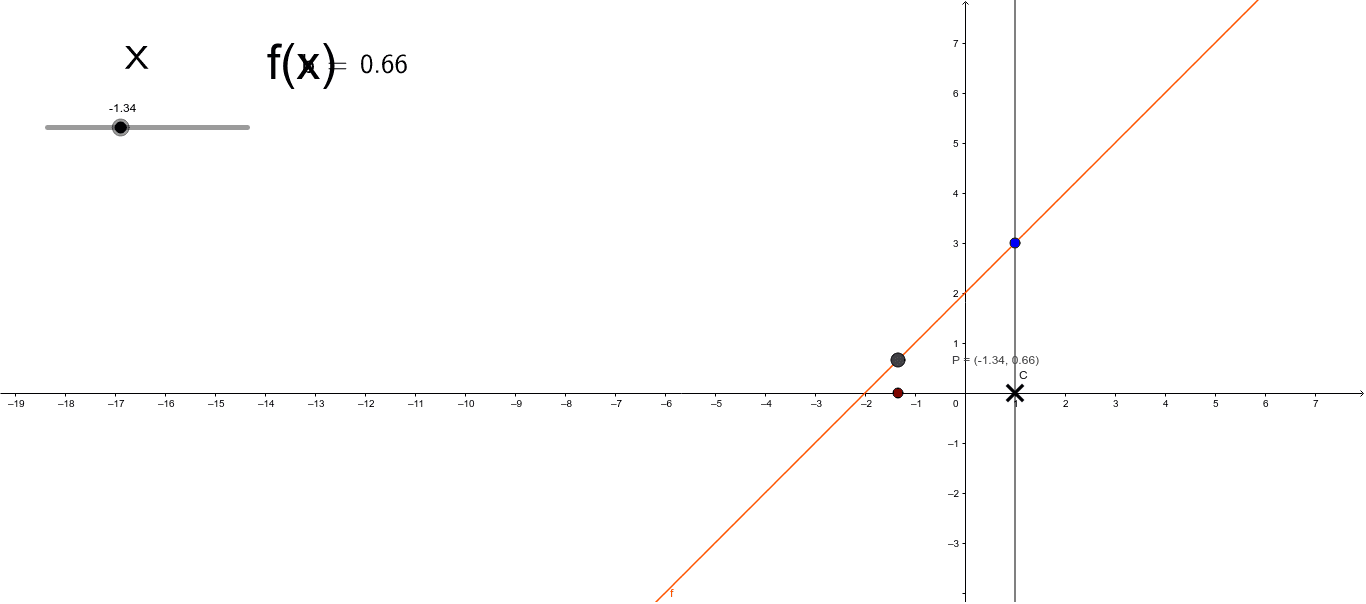
This example demonstrates the calculation and geometric representation of function limits near specific points. It involves core math concepts like limits, addition, power functions, volume, rational numbers, and geometry. Construction highlights include using GeoGebra commands like LaTeX, points, lines, polygons, and objects such as f, a, b, P, text annotations, and geometric shapes. Suitable for high school students and math enthusiasts studying calculus and geometric applications.
GeoGebra Commands & Parameters
LaTeX(b, true, true) → text1Point(xAxis) → CLine(C, c) → dLaTeX(b, true, true) → text2Polygon(B, D, E) → poly1, e, b_1, d_1
AI Drawing Prompt Reference
Draw a function limit demonstration, including an x-axis and a point, draw a line through the point, label two values on the x-axis, form a polygon with these values and the line, and label one of the values.
The prompt above was compiled from the original drawing commands and is for reference only.