
Lattice Points under Hyperbola
Loading the math board and drawing, please wait…
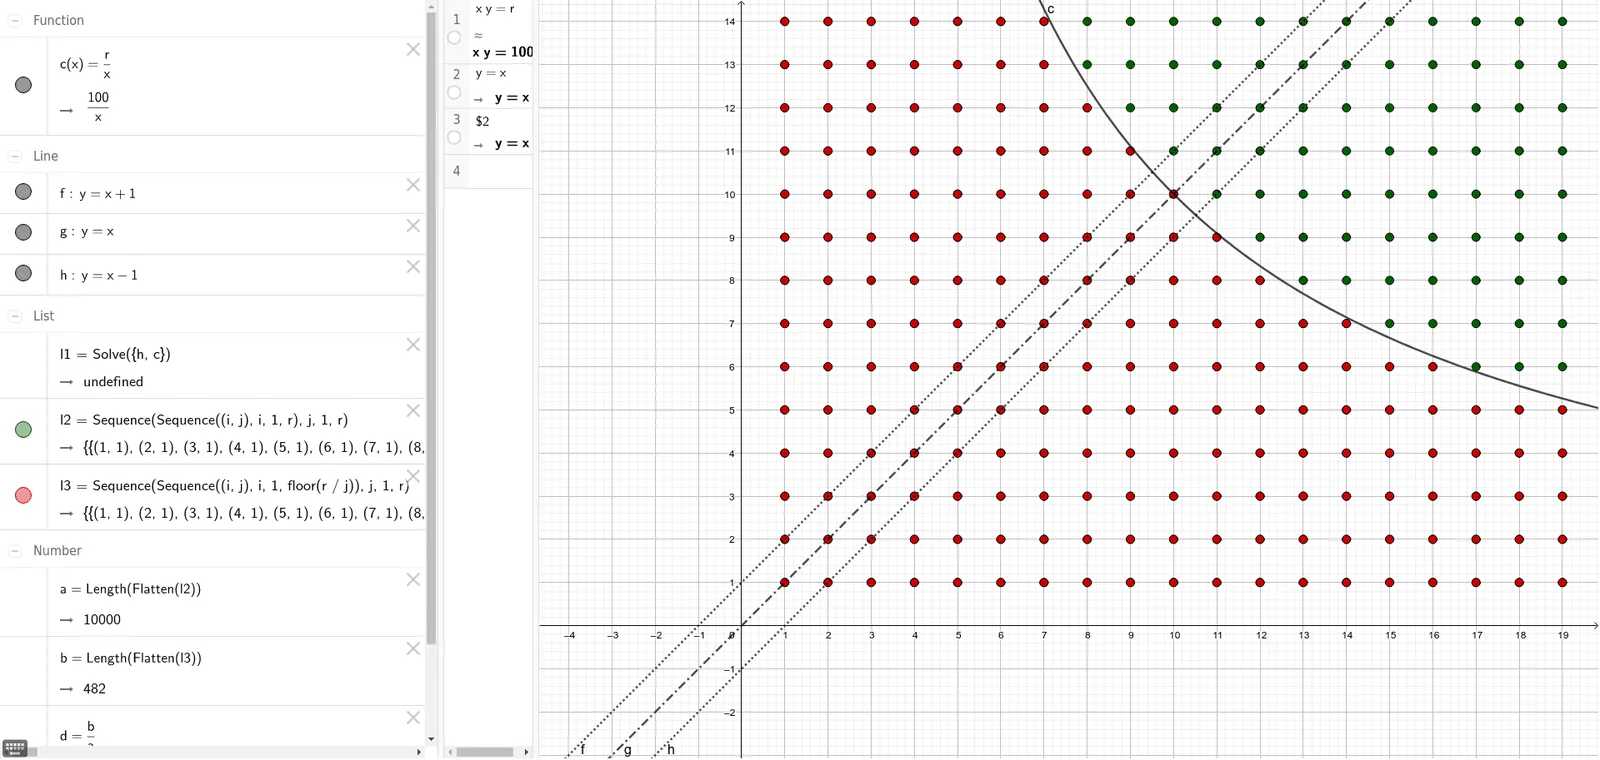
This example demonstrates the distribution of lattice points within the region below a hyperbola. It involves core mathematical concepts such as hyperbolas, exponential functions, logarithmic functions, linear programming or optimization, and similarity transformations. The construction utilizes GeoGebra commands like Solve, Sequence, and Length, with objects including r, f, g, h, c, l1, l2, l3, a, b, d. It is suitable for high school and above students learning about hyperbola properties and optimization problems involving lattice point counting.
GeoGebra Commands & Parameters
Solve({h, c}) → l1Sequence(Sequence[(i, j), i, 1, r], j, 1, r) → l2Sequence(Sequence[(i, j), i, 1, floor(r / j)], j, 1, r) → l3Length(Flatten[l2]) → aLength(Flatten[l3]) → b
AI Drawing Prompt Reference
Draw a region below a hyperbola and mark all lattice points within it. First, determine the equation of the hyperbola, then calculate all integer pairs (i, j) satisfying the condition below the hyperbola. Use different colors or styles to distinguish two sets of lattice points, and finally count and display the number of points in each set.
The prompt above was compiled from the original drawing commands and is for reference only.