
Lagrange Error Bound Demonstration
Loading the math board and drawing, please wait…
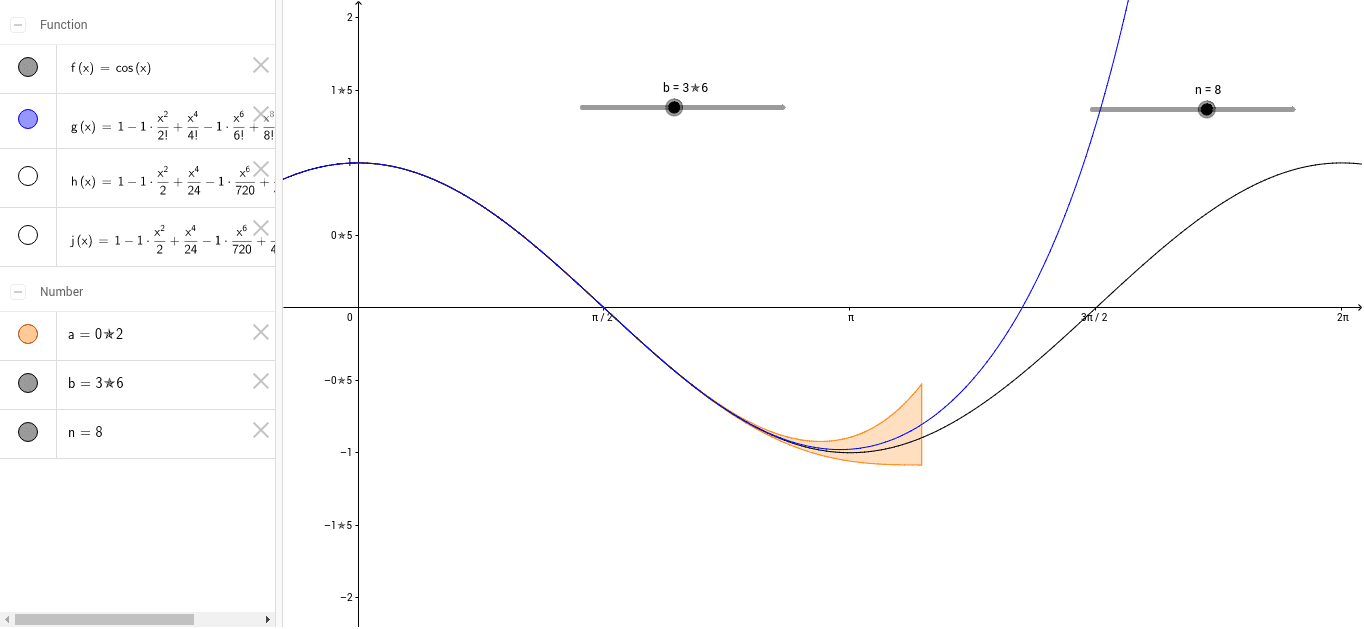
This example visualizes the calculation and bounds of error when approximating a function using Taylor series. It involves core mathematical concepts like Taylor series, error bounds, function approximation, and calculus concepts including integration and derivatives. GeoGebra commands used are TaylorSeries and IntegralBetween, with objects like function f, order n, approximation g, error function h, limits j and b, and point a. Suitable for high school students and above, particularly those learning calculus for understanding accuracy and error control in function approximation.
GeoGebra Commands & Parameters
TaylorSeries(f, 0, n) → gIntegralBetween(h, j, 0, b) → a
AI Drawing Prompt Reference
Draw a function with its Taylor series approximation, showing the error function and integral of the error, label the function, Taylor series, error function, integral interval, and error bounds, first draw the function and Taylor series, then the error function and its integral area, finally label the integral interval and error bounds.
The prompt above was compiled from the original drawing commands and is for reference only.